4-Quadrant Matrix: A Beginner's Guide to Stock Screening on Mahersaham App

Are you a new investor (newbie) who diligently researches stocks but often feels overwhelmed by the thousands of counters on the market? For active users of the Mahersaham Stock Screening Guide, you have probably come across various company categories. Some report massive profits yet their share price drops, while others are loss-making companies whose prices keep soaring.
How do you make the right choice?
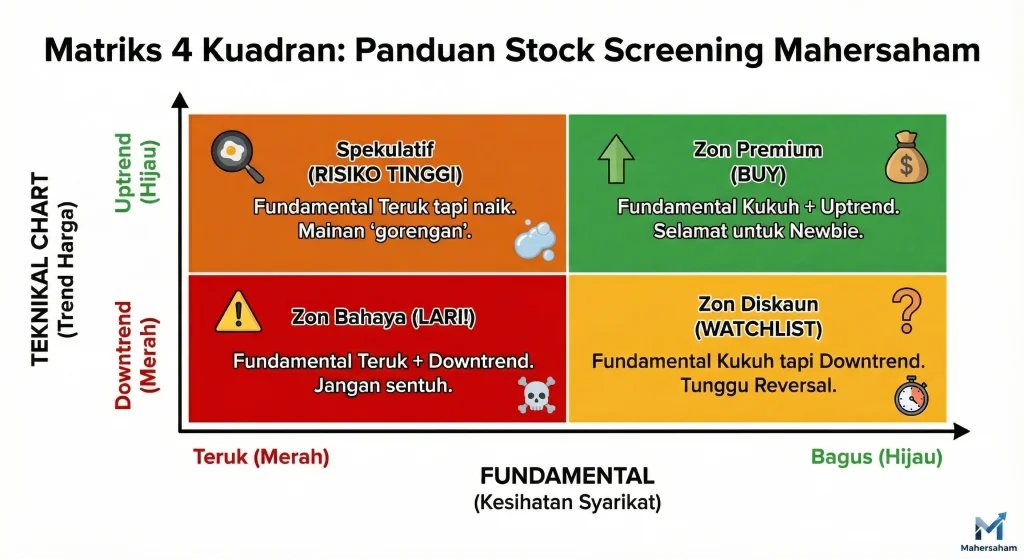
Fundamentally, every screening result can be classified into four main scenarios using the '4-Quadrant Matrix' concept. This classification combines the two most critical elements in investing:
- Strong Fundamentals: The financial health of the company.
- Technical Analysis: The strength of the chart trend (Strong Chart).
Here, we break down the four must-know scenarios before you press the 'Buy' button.
If you are a newbie still unsure about what fundamental and technical analysis means, continue reading here first: 2 Types of Stock Analysis – Fundamental and Technical
Strong Fundamentals + Uptrend Chart (The Premium Zone)
This is the 'golden' category that savvy investors always hunt for. In this scenario, the company not only records impressive financial profits but its share price is also on a strong upward climb (uptrend).
- Analysis: Market momentum and company fundamentals are moving in tandem.
- Action for Beginners: This is the safest zone to begin investing. Risk is more controlled thanks to strong fundamental support.
Strong Fundamentals + Downtrend Chart (The Discount Trap)
Often regarded as a 'discount' zone, investors need to exercise caution here. Although the company has solid financials, current market sentiment is pushing the price down.
- Analysis: There may be panic selling or temporary sentiment pressuring the price.
- Action for Beginners: Do not rush to catch a falling knife. The best strategy is to add it to your Watchlist. Wait for a clear reversal signal before buying.
Weak Fundamentals + Uptrend Chart (The Speculative Bubble)
This category is classified as speculative stocks. The price increase is usually driven by rumours, short-term catalysts, or pure market manipulation without genuine company performance backing it up.
- Analysis: The price rise is fragile and can plummet at any time.
- Action for Beginners: The risk here is extremely high. You are advised to avoid getting trapped. Do not chase the price if you are not skilled at reading intraday charts.
Weak Fundamentals + Downtrend Chart (The Danger Zone)
This is the absolute danger zone. The company is suffering financial losses and its share price is also plunging.
- Analysis: There are no positive indicators whatsoever, neither financial nor technical.
- Action for Beginners: If you find a counter like this in the screener, run far and run fast. There is no justification for buying assets in this category.
Focus on the First Quadrant
As a wise move, investors are encouraged to always focus on the First Quadrant: companies with strong fundamentals aligned with positive technical movement.
Proper use of the screener in the Mahersaham app can help you filter out unnecessary loss risks and save you research time.
Remember, in stock investing, Capital Preservation (protecting your capital) is more important than chasing profits alone.
Mahersaham Gold Package
Still unsure where to find high-quality stocks with uptrend counters?
Do not make the mistake of buying the wrong stock — buying wrongly is like handing your capital to market sharks to devour alive.
Through the Mahersaham Gold Package, we have helped many new investors learn screening techniques for both trading counters and buy-and-hold counters.
Do not confuse the two — you need to match them to the risk level and emotions you can handle.
Once you join the Mahersaham Gold Package, you will not just understand the market — you will transform 360 degrees into a trader who:
- Becomes an Expert in Stock Screening: You will know how to differentiate between trading counters, speculative counters, and investment-grade stocks. No more confusion.
- Masters All Indicators: No more headaches staring at blank charts. You will understand which indicators are most effective for current market conditions.
- "Sharper" at Reading Market Trends: One glance at the chart and you will instantly see whether the market is Bullish or turning Bearish. No more going against the flow!
- Sniper Entry & Exit — No More Spray and Pray: This is the most valuable skill. You will know the exact entry point to minimise risk, and the exact exit point to take profit before it turns into a loss.
- Pro TradingView User: No need to copy other people's charts. You will be able to customise your own indicator settings on TradingView to suit your trading style.
- Free from "Buy Call" Addiction: No more waiting for signals from others. You will have full confidence to make your own decisions (self-reliant trader).
Subscribe Using the Link Below. For a Discount, Enter Coupon Code GOLD20:
https://app.mahersaham.com/pakejgold/873
https://app.mahersaham.com/pakejgold/873
https://app.mahersaham.com/pakejgold/873

Level Up Your Investment Knowledge
Successful investing starts with solid knowledge. Continue your learning journey.
Investment Basics:
Want to learn from scratch? Download our free ebook for a complete guide.
Open a CDS Account:
Ready to start? Open a CDS account and put what you have learnt into practice.
Read Also:
Discover the 10 dividend investing mistakes you need to avoid.
FAQ – 4-Quadrant Matrix Stock Screening
What is the 4-Quadrant Matrix in stock screening?
The 4-Quadrant Matrix is a classification framework that combines fundamental analysis (company financial health) with technical analysis (chart trend strength) to categorise stocks into four scenarios: Premium Zone, Discount Trap, Speculative Bubble, and Danger Zone.
Which quadrant is safest for beginner investors?
The First Quadrant — Strong Fundamentals + Uptrend Chart (The Premium Zone) — is the safest for beginners because both financial performance and market momentum are aligned, reducing overall risk.
Should I buy a stock with strong fundamentals but a downtrend chart?
Not immediately. While the company may be financially sound, a downtrend chart suggests negative sentiment. The recommended approach is to add it to your Watchlist and wait for a clear reversal signal before buying.
How does the Mahersaham app help with stock screening?
The Mahersaham app provides screeners that filter stocks based on fundamental and technical criteria, helping investors quickly identify which quadrant a stock falls into and make more informed decisions.