Bollinger Bands: A Trader's Essential Technical Analysis Tool
Bollinger Bands
One of the most well-known and frequently used indicators by traders and investors when reading charts is the Bollinger Bands indicator.
The application used in this video is: TradingView (free on the internet)
There are 3 important lines in this indicator:
- Upper Band
- Middle Band
- Lower Band
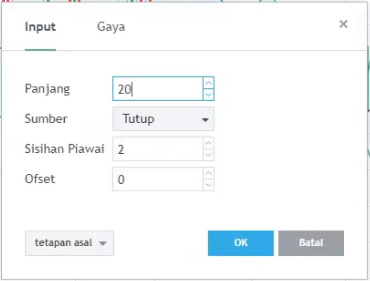
Referring to the figure:
- Length (20) represents the number of candlesticks used in the calculation. For example, 20 refers to 20 candlesticks. If your timeframe is daily, then 20 represents 20 days; if your timeframe is weekly, then 20 refers to 20 weeks.
- Source (close) means that the closing price is used in the calculation.
- Standard deviation = amplitude = coefficient = multiplier
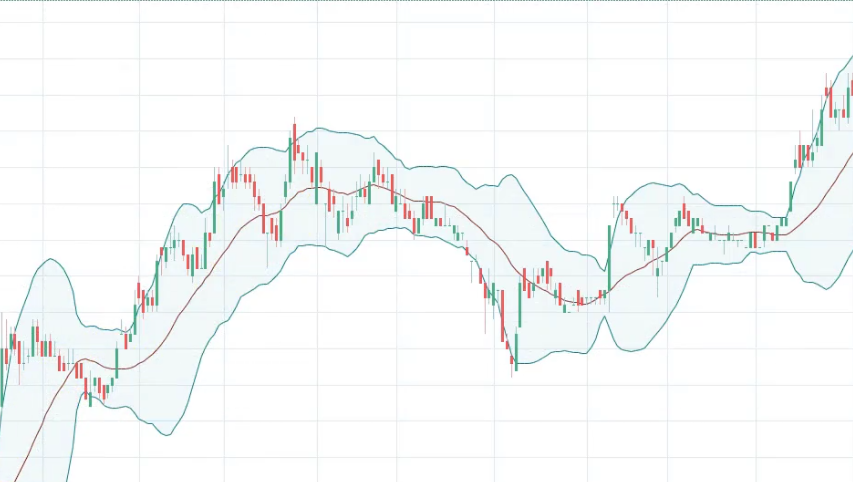
Referring to Figure 2:
- Middle Band (the red line in the centre): The middle band is essentially a Moving Average (MA). If the value of 20 is used in the Bollinger Bands setting, this line represents the 20-day Moving Average (using a daily timeframe).
- Upper Band (the green line above): The upper band is drawn using the standard deviation formula. The formula is: MA + 2(standard deviation).
- Lower Band (the green line below): The lower band is drawn using the standard deviation formula. The formula is: MA - 2(standard deviation).
There are 2 techniques for using the Bollinger Bands indicator:
- Support and Resistance
- Bollinger Band Squeeze
Watch the full video for a more detailed explanation on how to use this indicator, where to buy and sell, and several examples based on real charts. On our website, you can find many more explanations related to technical analysis knowledge.
Enhance Your Investment Knowledge
Successful investing begins with a solid foundation of knowledge.
Investment Basics:
Download our free ebook for a comprehensive guide to stock market investing.
Open a CDS Account:
Ready to start trading? Open a CDS account with Mahersaham and gain access to exclusive classes for Mahersaham clients.
FAQ – Bollinger Bands Technical Analysis
What are Bollinger Bands and how do they work?
Bollinger Bands are a technical analysis indicator consisting of three lines: an upper band, a middle band (which is a Moving Average), and a lower band. The upper and lower bands are calculated using standard deviations from the moving average. They help traders identify overbought and oversold conditions, as well as periods of high and low volatility.
What is the default setting for Bollinger Bands?
The default setting for Bollinger Bands is (20, close, 2) — meaning a 20-period moving average using closing prices, with the bands set at 2 standard deviations above and below the moving average. This setting works well for most timeframes including daily and weekly charts.
How do you use Bollinger Bands for trading on Bursa Malaysia?
There are two primary techniques: (1) Support and Resistance — using the upper band as resistance and the lower band as support to identify potential entry and exit points; (2) Bollinger Band Squeeze — when the bands narrow, it indicates low volatility and often precedes a significant price breakout in either direction.
Can Bollinger Bands be used together with other indicators?
Yes, Bollinger Bands work best when combined with other technical indicators such as RSI (Relative Strength Index), MACD, or volume analysis. Using multiple indicators together helps confirm signals and reduces the likelihood of false breakouts.