Bullish Candlestick Patterns – 8 Types Every Trader Must Know
What Is a Bullish Candlestick
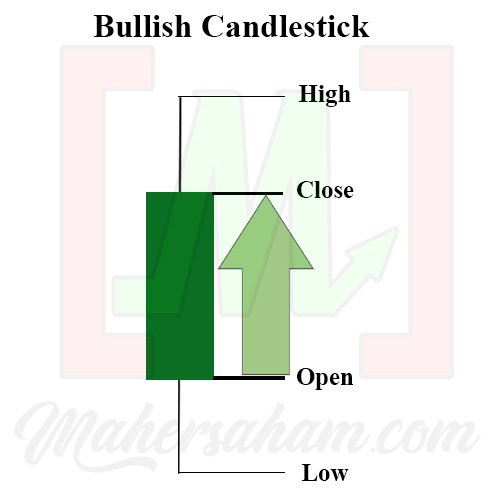
The term bullish candlestick is derived from the animal ''bull''. If you have noticed, how does a bull attack?
A bull charges from the bottom upwards. This is why bullish candlestick patterns are also known as price increase signals.
A green bullish candlestick means the stock price has risen, which occurs because there are more buyers than sellers.
Types of Bullish Candlestick Patterns
- Bullish Engulfing
- Three White Soldiers
- Morning Star
- Bullish Harami
- Tweezer Bottom
- Inverted Hammer
- Hammer
- Dragonfly Doji
Bullish Engulfing
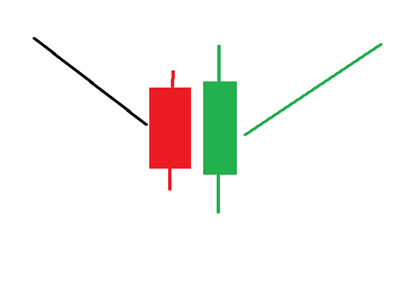
Initially the market is in a downtrend. When a bullish engulfing occurs, a reversal pattern takes place.
This means an uptrend will follow.
What are the criteria for a bullish engulfing? The candle will ''engulf'' the candle beside it.
What does that mean?
Refer to the diagram above.
The condition described is when the green candlestick completely engulfs the red candlestick.
You can refer to the example from TradingView below.
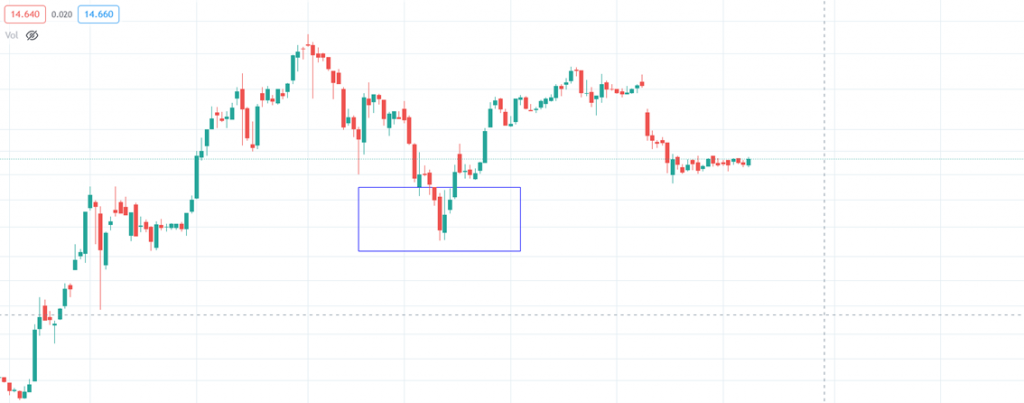
When the market is in a downtrend and then a bullish engulfing pattern appears, a reversal pattern occurs. An uptrend follows.
Three White Soldiers
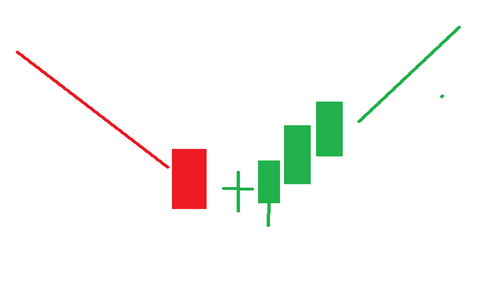
This pattern occurs when there are three consecutive days of price increases.
It typically appears in two situations.
First, during a trend reversal.
The market is in a downtrend, then Three White Soldiers appear, signalling a reversal trend – an uptrend occurs.
Second, when the market is in an uptrend and then goes sideways briefly.
When the market is sideways and then Three White Soldiers appear, the uptrend will resume and move even higher.
Refer to the diagram below.
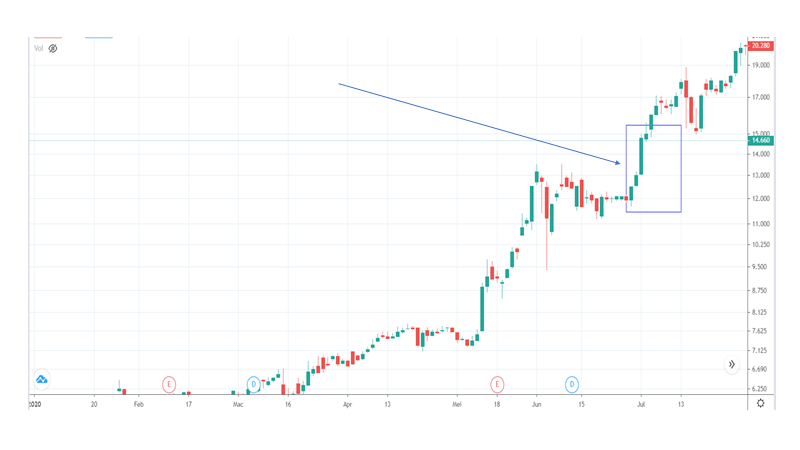
Most Three White Soldiers patterns occur during a trend reversal.

Morning Star
Focus on the 3 candlesticks within the box in the diagram below.
When the market is in a downtrend, the first candlestick is red.
Then there is a gap down with a small second candlestick (regardless of whether it is red or green) at the bottom.
Next, the third candlestick is green, but its length does not exceed the first red candlestick.
Understood?
Refer to the image below.
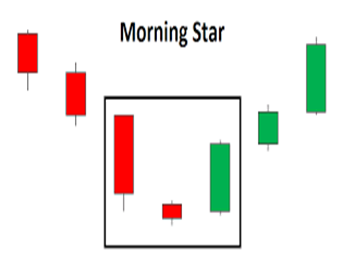
If you spot this formation, it is a Morning Star signal.
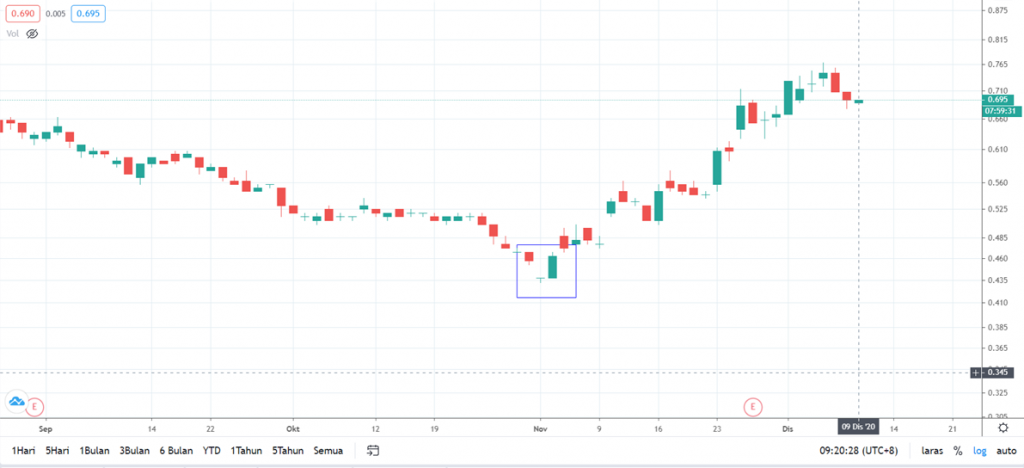
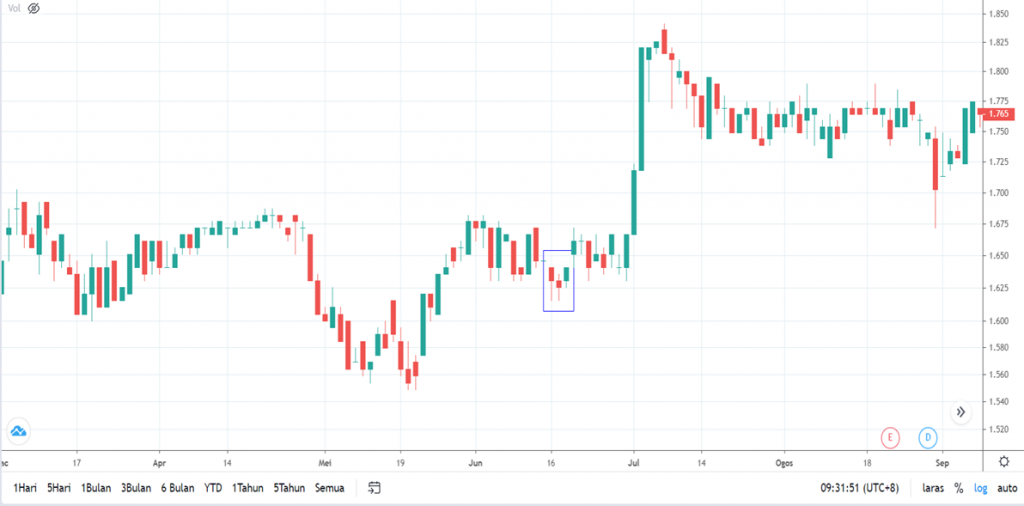
Bullish Harami
The market is in a downtrend, then a reversal pattern occurs – an uptrend.
A bullish harami occurs when the first candlestick is red, followed by a second green candlestick that is smaller in size.
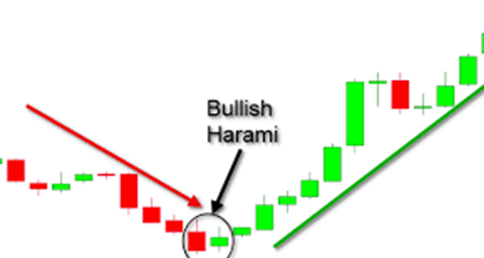
The green candlestick does not exceed the length of the first red candlestick.
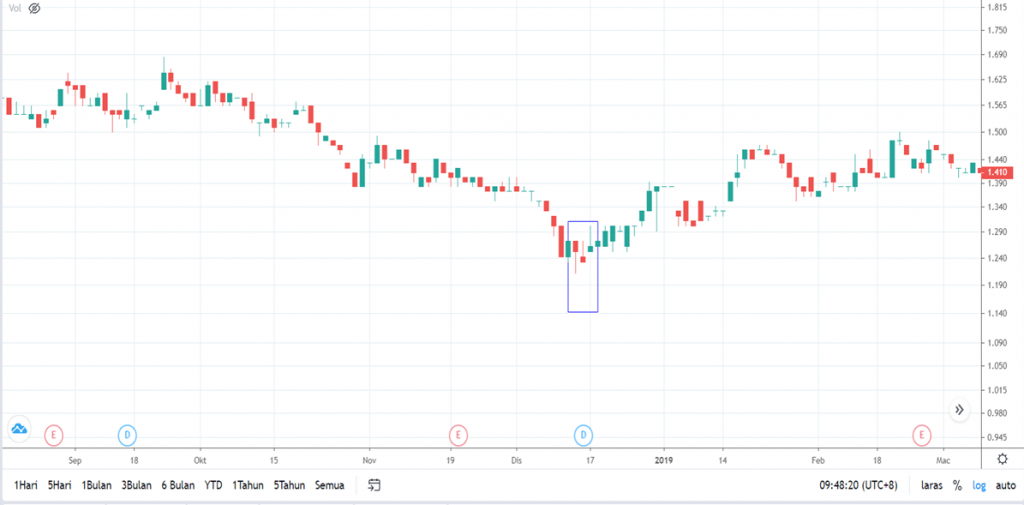
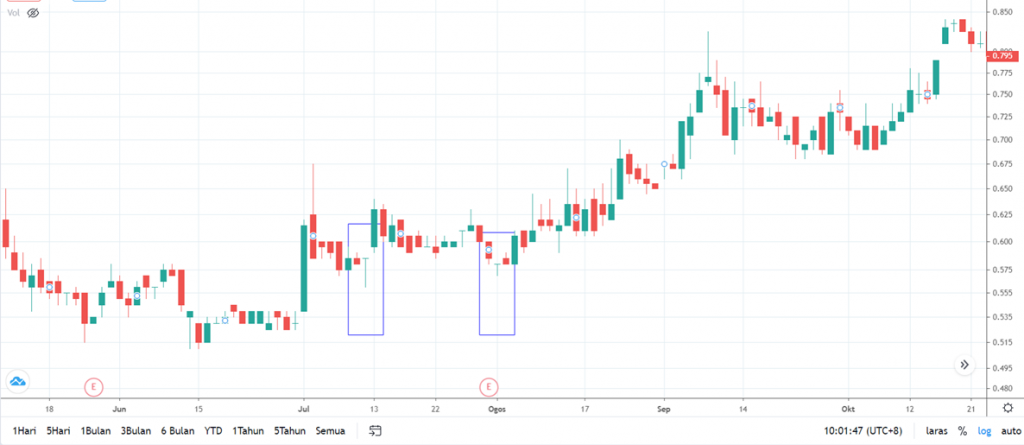
Tweezer Bottom
This occurs when the green/white and red/black candlesticks are nearly equal at the bottom (during a downtrend).
This signals a reversal.
Refer to the image below.
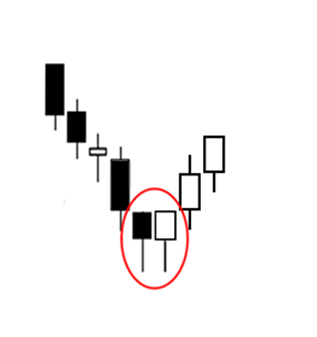
However, this pattern is quite rare to encounter.
Inverted Hammer
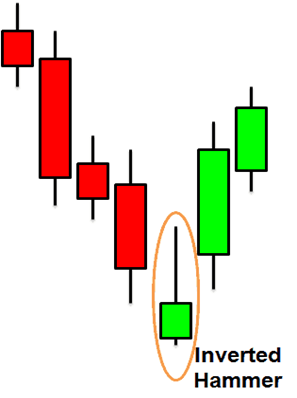
As the name suggests, it resembles an inverted hammer. The candlestick tail extends upwards. You can refer to the diagram above.
It occurs during a downtrend as a reversal pattern.
Hammer
A candlestick is called a hammer when the lower tail is longer than the body.
For your information, the candlestick does not have to be green. It can also be red.
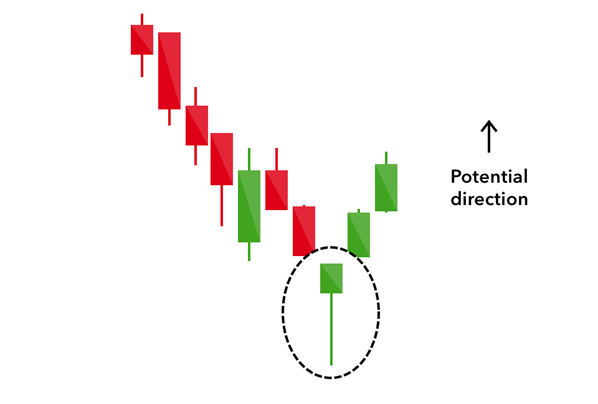
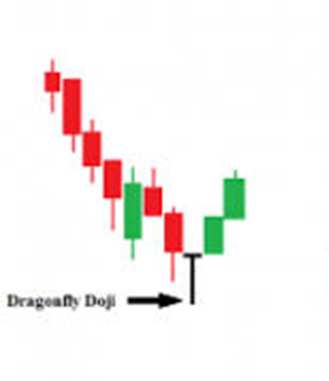
Dragonfly Doji
This pattern is easy to identify because it resembles a capital letter T, except that the tail is longer.
Refer to the diagram below.
A Dragonfly Doji can occur as both a reversal pattern and a continuation pattern.
What does this mean?
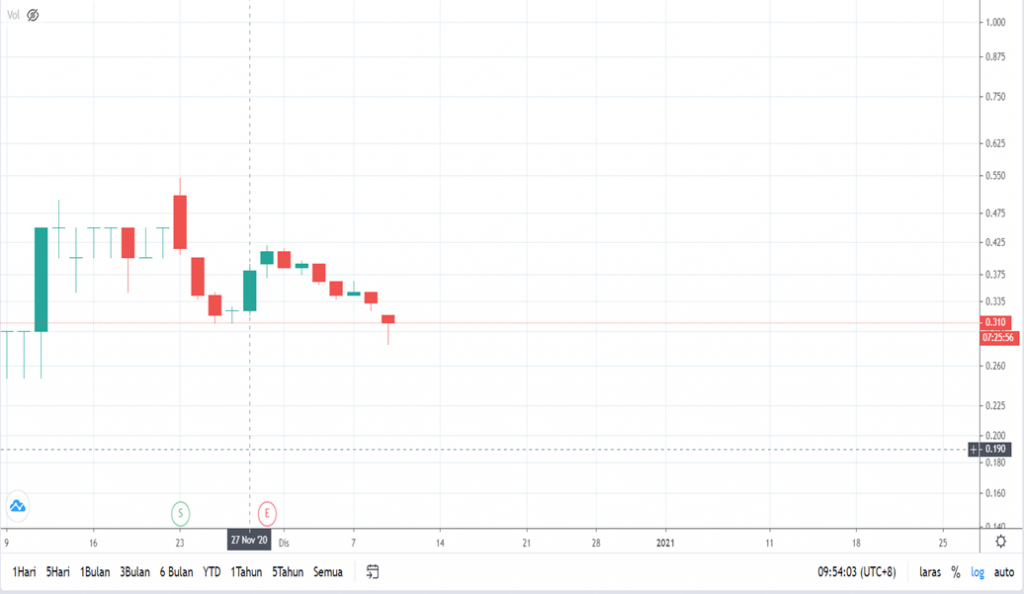
The market is in a downtrend, then a Dragonfly Doji appears, the chart rises slightly to form a higher low, then another Dragonfly Doji appears to continue the uptrend.
You can refer to the example below.
We hope you now have a solid understanding of bullish candlestick patterns.
This knowledge will make it easier for us to create a trading plan.
Remember, there are many more types of bullish candlestick patterns.
Today we have covered 8 types of bullish candlestick patterns.
We hope this has been beneficial!
FAQ – Frequently Asked Questions
1. What is a bullish candlestick pattern?
A bullish candlestick pattern is a chart formation that signals a potential price increase. The term ''bullish'' comes from how a bull attacks – charging from the bottom upwards – representing upward price movement.
2. How many types of bullish candlestick patterns are there?
There are many types, but the 8 most common ones are Bullish Engulfing, Three White Soldiers, Morning Star, Bullish Harami, Tweezer Bottom, Inverted Hammer, Hammer, and Dragonfly Doji.
3. Which bullish candlestick pattern is the most reliable?
Bullish Engulfing and Morning Star are generally considered the most reliable reversal patterns, especially when they appear at strong support levels with high trading volume.
4. Can bullish candlestick patterns be used for all types of stocks?
Yes, bullish candlestick patterns can be applied to all types of stocks and markets, including Bursa Malaysia. However, they should be used together with other technical indicators for more accurate analysis.
New to Stocks?
Want to learn about stocks? Want to know more?
But not sure where to start?
Do not worry – download the FREE ebook from Mahersaham now!
And click here to open a CDS account with Mahersaham.