Gann Theory: Understanding Geometry and Time Cycles in the Stock Market
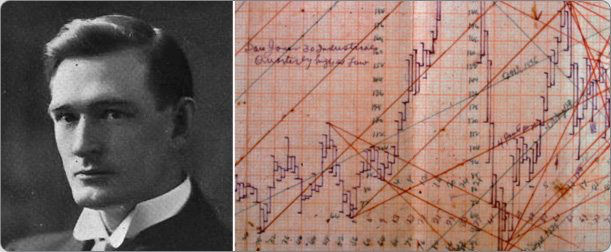
This theory was first introduced by William D. Gann in the early 1900s. As a successful market trader of his era, Gann firmly believed that stock prices do not move randomly; instead, they change according to specific angles.
He discovered that price movements have a close relationship with natural geometric shapes and can forecast future movements when linked with time. Because of this, his approach is often known as "Gann Angle Theory".
If applied correctly, Gann's trading strategy is said to be capable of predicting asset movements with high accuracy. W.D. Gann believed that markets adhere to natural time cycles. His theory was founded on a combination of geometric shapes and ancient mathematical principles. Fundamentally, the patterns and angles of an asset in the market can serve as primary indicators for forecasting where the price is heading next.
Understanding Gann Angles
W.D. Gann developed several unique techniques for evaluating price charts. He believed that every angle and pattern has its own distinct character that can be used to predict price action. What is unique about Gann charts is that they use equal price and time scales.
In Gann Angles, a 1x1 movement always equals a 45-degree angle. Gann emphasised that the best balance between price and time occurs when they rise or fall at a 45-degree angle relative to each other.
To draw Gann Angles, we need a significant high or low point on the chart:
- Bullish Market: When the price is above the trendline.
- Bearish Market: When the price is below the trendline.
Gann maintained that the 1x1 trendline provides the primary support and resistance in an uptrend. If this line is breached, it is a major signal that the market trend is about to reverse direction.
Gann outlined nine key angles, with 1x1 being the most critical:
- 1 x 8 – 82.5 degrees
- 1 x 4 – 75 degrees
- 1 x 3 – 71.25 degrees
- 1 x 2 – 63.75 degrees
- 1 x 1 – 45 degrees (Primary Angle)
- 2 x 1 – 26.25 degrees
- 3 x 1 – 18.75 degrees
- 4 x 1 – 15 degrees
- 8 x 1 – 7.5 degrees
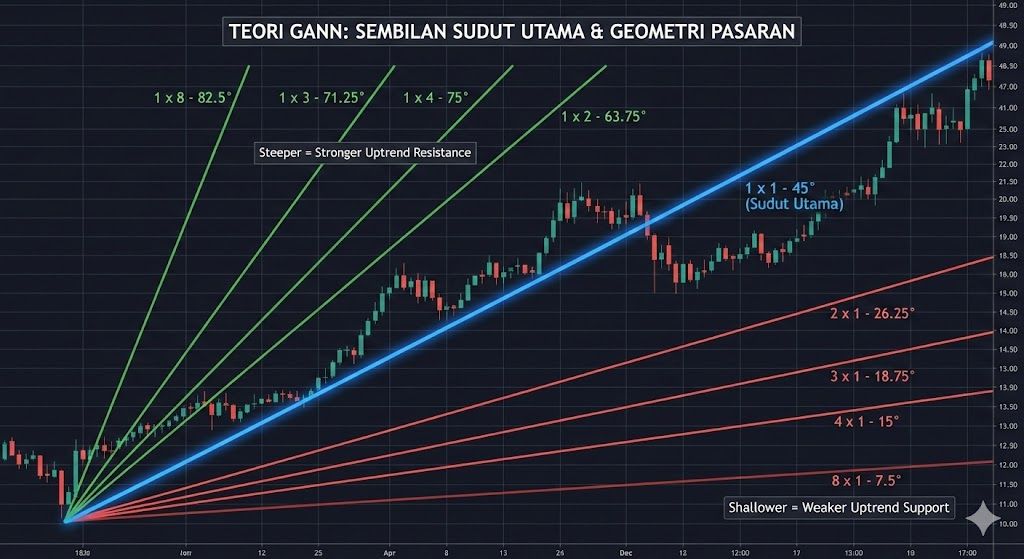
Gann's observations found that all these angles act as support and resistance levels depending on the current trend. The 1x1 angle is the cornerstone; when the price begins to fall below this angle line, it often becomes an early sign of a trend reversal.
Gann Theory Fundamentals
You can understand this concept more quickly through intraday trading using Gann Angles. Let us look at a simple example: If the market is in an uptrend and does not breach the trendline, this means the market will maintain its upward momentum until that angle line is breached.
This theory is very useful for traders to achieve good returns. There are many books on Gann Theory in the market that can be used as references to support your trading strategy.
Gann Theory Applications: Three Key Approaches
Market patterns can be studied using a combination of Gann's price and time theory:
Price Study: With the help of Gann Angles, you can track stock price movements. Pivot levels are used to forecast future movements, whilst support and resistance levels help determine the stock price position.
Time Study: Gann's time model gives traders an indication of when a stock's value might change direction. It requires reviewing historical data to view the current price. This theory allows traders to estimate when prices may fall by examining price movements across different time periods.
Pattern Study: The use of patterns helps detect stock movements and investor activity. This study encompasses trends and formations that signal reversals in stock movements.
Read our article on Gann Square: How to Use Gann Square of Nine Easily
How to Use the Gann Trading Strategy
This strategy was developed based on three main assumptions:
- Stock market movements are governed by time cycles.
- Markets are geometric in their design and movement.
- Markets are only influenced by price, time, and range.
Traders must remember that markets move at various angles, and these angles remain the same — they only rotate in position.
One important concept is the "Rule of All Angles". An asset can move from one angle to another. This rule states that when one angle has been reached, the asset will move towards the next angle. Typically, Gann angles are used to identify support and resistance lines.
- Support Breach: Known as a break, this signals that the price will decline.
- Resistance Breach: Known as a breakout, this means the price will move upward.
After traders have determined the time period, they will draw Gann angles on the chart (1X1, 2X1, 3X1, and so on). These lines are then interpreted to understand price movement.
Important Note: An ascending angle indicates support, whilst a descending angle indicates resistance.
Sometimes, a combination of horizontal lines and angles is used to determine critical levels. For example, if a stock is bullish, it may retrace by 50%. This level will act as support. Conversely, if a stock is bearish, the 50% level becomes strong resistance. The area where multiple angles converge is also known as "price clusters".
Source: Nirmal Bang
Learn Gann Techniques with Us
Market Geometry: The Secrets of W.D. Gann's Angles
Many traders only focus on price movements but often overlook the element of time.
In Gann Theory, market equilibrium is determined by geometric angles — particularly the 45-degree angle (1x1). If you understand how price and time move in tandem, you can forecast reversal points more objectively, rather than merely guessing.
Want to learn how to apply "Gann's Mystery Technique" to your stock charts?
Join our sharing session:
Workshop: Gann Mystery Technique. Date: 10 February 2026 (Tuesday). Time: 8:30 PM (Estimated). Location: Online
Do not let your charts be directionless. Understand geometry, master the trend.
Register here:
FAQ: Frequently Asked Questions About Gann Theory
1. What is Gann Theory?
Gann Theory is a technical analysis method developed by W.D. Gann in the early 1900s. It combines geometric shapes, time cycles, and mathematical principles to forecast stock price movements. The theory holds that prices do not move randomly but follow specific angular patterns.
2. What is the most important Gann Angle?
The 1x1 angle (45 degrees) is the most critical Gann Angle. It represents the ideal balance between price and time. When the price falls below this line, it is often an early signal of a trend reversal.
3. How do I draw Gann Angles on a chart?
To draw Gann Angles, you need to identify a significant high or low point on the chart. From that point, draw lines at the prescribed angles (1x1, 1x2, 2x1, etc.). Most modern charting platforms like TradingView have built-in Gann Angle drawing tools.
4. Is Gann Theory still relevant today?
Yes, Gann Theory remains relevant and is used by many technical traders worldwide. Whilst it was developed over a century ago, the underlying principles of geometric relationships between price and time continue to be observed in modern markets.
5. Can beginners use Gann Theory?
Gann Theory is considered an advanced technical analysis method. Beginners should first master basic concepts such as support and resistance, moving averages, and basic candlestick patterns before attempting to apply Gann techniques. If you are new to investing, we recommend downloading our free Stock Basics Ebook at /ebookasas first.