History and Importance of Candlestick Charts

Candlestick in Technical Analysis
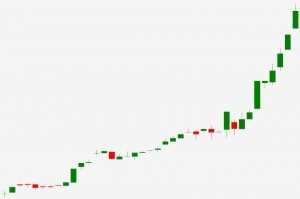
In technical analysis, the CANDLESTICK is the CORE ELEMENT. We trace the movement of a counter through candlestick analysis.
So in this post, we shall first learn about its history and why it is so important in investing. As the old saying goes, "You cannot love what you do not know".
History
Candlestick charts have existed since the 17th century in Japan and the 19th century in the United States.
It all began with rice trading in Japan around 1654, followed by gold, silver, oil, and tin.
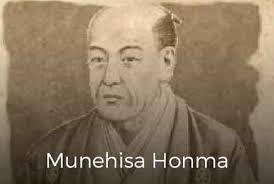
Munehisa Homma (Sokyu Honma), a rice trader born in the early 1700s, understood the principles of SUPPLY & DEMAND and how emotions play a role in price determination.
He wanted to track market participants'' emotions, and this became the foundation. Because of his work, he was highly respected and elevated to the rank of SAMURAI.

The knowledge of CANDLESTICK charts was closely guarded by the Japanese to prevent the West from learning it, until the 1980s when a major cross-pollination of banks and financial institutions occurred worldwide.
The Japanese did an excellent job of keeping candlesticks quiet from the Western world, until the 1980s, when suddenly there was a great cross-pollination of banks and financial institutions around the world.
It was during this time that several WESTERN ANALYSTS became interested in CANDLESTICK knowledge. In the UK, MICHAEL FEENY, who was then the head of Technical Analysis in LONDON for SUMITOMO, used CANDLESTICKS in his daily work and began introducing the concept to LONDON PROFESSIONALS.
In December 1989, the editor of FUTURES MAGAZINE, Steve Nison, published an article showcasing a "series of candlestick reversal patterns" and explaining their predictive power.
It was through these efforts that CANDLESTICK knowledge spread to what it is today.
Why Are Candlestick Charts So Important in INVESTING?
1. It is considered a way for us to see what is happening in the market.
2. Flexibility means CANDLESTICK charts can be combined with other technical analysis tools such as MOVING AVERAGES and MOMENTUM OSCILLATORS.
Additionally, they can also be combined with Dow Theory and Elliott Wave Theory.
3. They can also help us understand changes in human behavioural psychology related to money, such as GREED, FEAR, and sky-high HOPE.
With this knowledge, we can understand how buyers and sellers interact with one another in trading.
4. Candlestick charts also provide us with more important information compared to BAR CHARTS by using a "WIN-WIN" situation, because with CANDLESTICKS we can identify all trading signals occurring in the MARKET.
5. Candlestick charts are widely used by PROFESSIONAL TRADERS, BANKS, and Hedge Funds. They are categorised as PROFESSIONALS who trade millions in value every day.
These professionals can move market prices when they wish because their capital is extremely large.
How to Learn More About Candlestick Charts
1. Learn on YouTube
If you prefer learning through video, we recommend heading to youtube.com and searching for ''candlestick''. However, most content is in English, and may not specifically cover the Bursa Malaysia stock market.
2. Visit Babypips.com
This is one of the websites we used to visit frequently. In one of the syllabi created at babypips.com, there is a section teaching about candlesticks. The delivery style is casual and easy to understand.
3. Join the Mahersaham Premium Student Group
This is the option if you wish to understand ''candlestick'' charts in Bahasa Melayu. The learning modules are online, with pre-recorded video lessons.
The examples shown are also more closely aligned and relevant to the Bursa Malaysia stock market.
Conclusion
Using CANDLESTICK charts helps us understand what the big players or INSTITUTIONS are doing. We can see when they ENTER or EXIT the market.
Like it or not, we need to learn this knowledge because of its widespread use and visual advantages compared to bar charts or line charts.
New to stocks?
Want to learn about stocks? Want to know more?
But not sure where to start?
Interested in Learning More About Stock Investing on Bursa Malaysia?
Want to buy and sell stocks but don''t have a CDS account yet?
What are you waiting for? Register for a CDS account with Mahersaham and you can join exclusive classes for Mahersaham clients.
You can also follow Mahersaham YouTube, Telegram Channel, and Facebook Mahersaham to keep up with the latest stock updates and information from us every week.