How to Detect Market Rebound: Key Reversal Signals Every Trader Should Know
This time we will learn 2 types of PATTERNS in TECHNICAL ANALYSIS that traders use to detect when the MARKET is about to rebound.
There are actually many more patterns, but this time we will cover just 2. If we shared everything at once, it might be overwhelming.
Before that, let us first understand what technical analysis (TA) and fundamental analysis (FA) are.
TA – Studies the effects of price movements
FA – Studies why price movements occur
The 2 PATTERNS are:
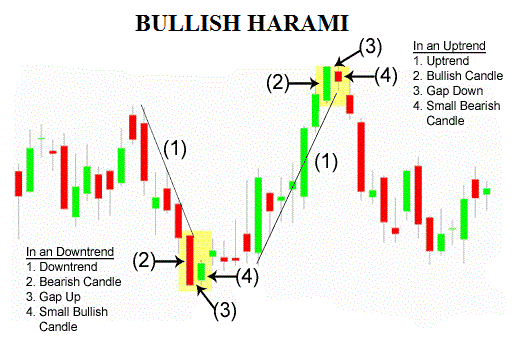
1. BULLISH HARAMI
The candlestick is in a downtrend and we can see a small positive candle forming.
This indicates that the market may be about to resume an UPTREND after selling activity has occurred and is possibly nearing its end.
As traders, we can start to prepare to BUY. However, do some research first to determine your ENTRY POINT.
Set your TAKE PROFIT and also your STOP LOSS.
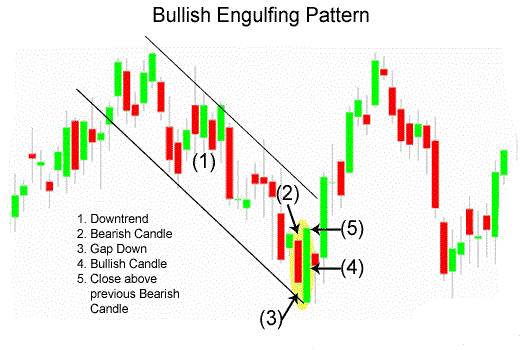
2. BULLISH ENGULFING
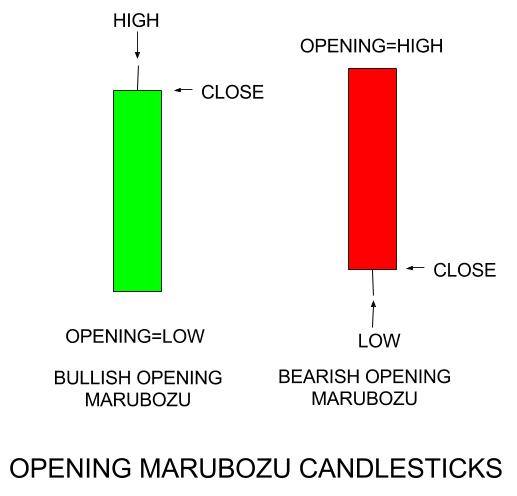
From the chart, we can see a MARUBOZU (REFER TO IMAGE 3 to understand what a MARUBOZU looks like) at the bottom, which signifies a BULLISH ENGULFING combination.
This tells traders that selling is almost over and the market is about to start an UPTREND.
This is where institutional investors ("sharks") begin their buying operations. As retail investors ("small fish"), we take the opportunity to follow when the institutions are making their moves.
Candlestick Analysis
The two patterns shown above are part of the Candlestick Analysis topic, as covered in the Advance Online Coaching for Mahersaham Premium.
Candlestick Analysis is the study of candlestick charts, one of the chart types widely used by investors in their stock analysis process.
To learn about the other types of charts available besides candlestick charts, you can refer here.
Conclusion
Investors should equip themselves with various types of knowledge and analysis.
This enables them to understand market movements and the factors driving the market at a deeper level, and as a result, they will be more confident in the Trading Plan derived from their own research.
Knowing how to detect a market rebound is also one of the analyses that can be performed to help in understanding market movements.
This knowledge and analysis will assist and facilitate their investment or trading decisions.
Seize this opportunity and learn from the BEST!
Frequently Asked Questions (FAQ)
What is a market rebound and why is it important for traders?
A market rebound is when share prices recover and move upward after a period of decline. It is important for traders because identifying a rebound early allows you to enter positions at lower prices before the uptrend resumes, maximising potential profits.
How does the Bullish Harami pattern signal a market rebound?
The Bullish Harami pattern appears during a downtrend when a small positive (green) candle forms within the body of the previous larger negative (red) candle. This signals that selling pressure is weakening and a potential reversal to an uptrend may be imminent.
What is the difference between Bullish Harami and Bullish Engulfing?
A Bullish Harami features a small positive candle contained within the previous candle's body, indicating a subtle shift. A Bullish Engulfing features a large positive candle that completely engulfs the previous negative candle (a Marubozu), signalling a stronger reversal with greater buying pressure.
Should I rely solely on candlestick patterns to detect a market rebound?
No, candlestick patterns should be used alongside other forms of analysis. Combine technical analysis (TA) with fundamental analysis (FA) for a more complete picture. TA shows you the effects of price movements, while FA explains why those movements happen. Using both gives you higher confidence in your trading decisions.
Interested in learning more about stock investing in Bursa Malaysia?
Download the Free Stock Basics Ebook
Want to buy and sell stocks but do not have a CDS account yet?
Register a CDS account with Mahersaham and you can join exclusive classes for Mahersaham clients.