How to Use Candlestick Analysis for Stock Trading
What Is Candlestick Analysis?
Between 1724 and 1803, candlestick analysis was used by Munehisa Homma, a rice trader in Japan.
He used candlestick analysis to track the fluctuations in rice prices during that era.
According to history, the distance between Munehisa Homma and the rice supply location at the time was quite far.
To obtain accurate analysis, he needed market price data delivered quickly.
As we know, in those days, there were no telephones or internet to get real-time data.
Can you guess how he managed to get data quickly back then?
What Munehisa Homma did was place a representative at the rice supply location and several more representatives at set intervals all the way to his home.
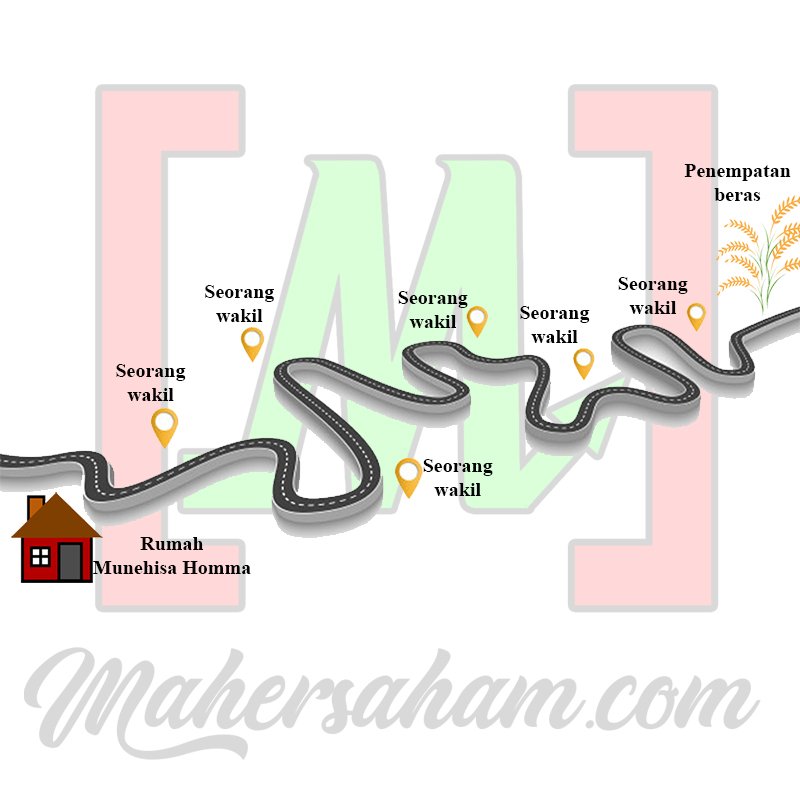
Through this method, he could obtain information about the current rice prices. From that data, he recorded and used candlestick analysis to become a successful rice trader in Japan.
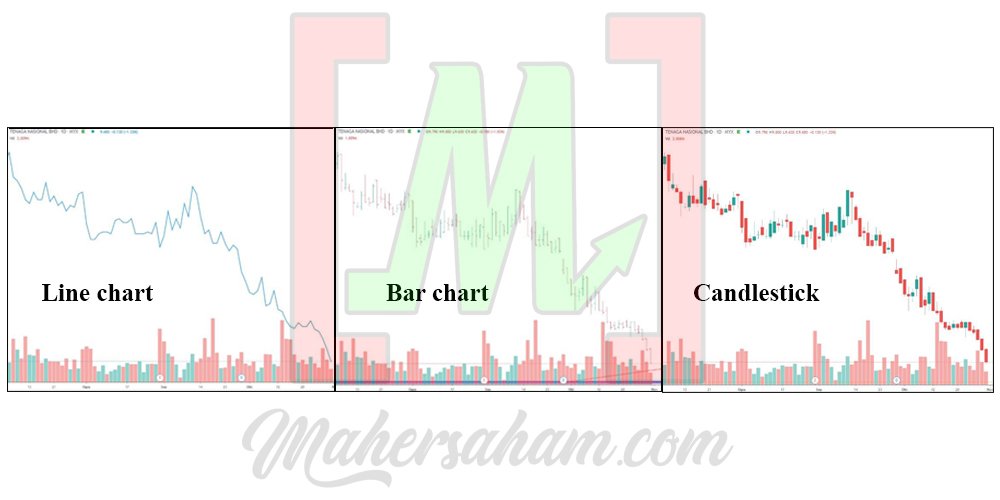
When stock exchanges emerged in the West, they were still using line charts and bar charts.
Steve Nison brought candlestick analysis to the West, and since then, people have widely adopted candlestick analysis as a replacement for line charts and bar charts.
Have you ever wondered why so many people switched to candlestick analysis? Why not just stick with line charts and bar charts?
How Are Candlesticks Formed?
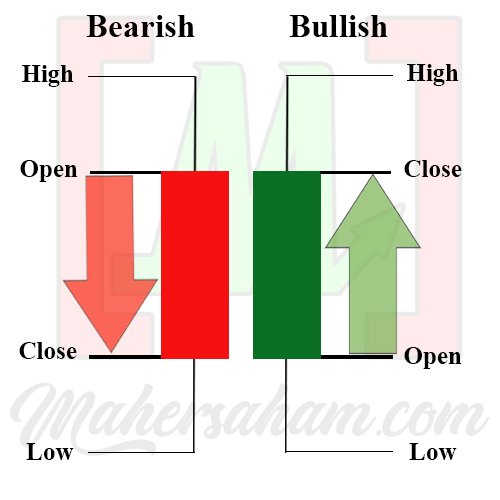
As we know, there are two types of candlesticks: bullish candlesticks (green) and bearish candlesticks (red).
Bullish Candlestick
It occurs when the open price is lower than the close price.
Let me use an example of a counter (refer to the image below).
Before that, here is some information about what is in the red box:
O: Open price
H: High price
L: Low price
C: Close price
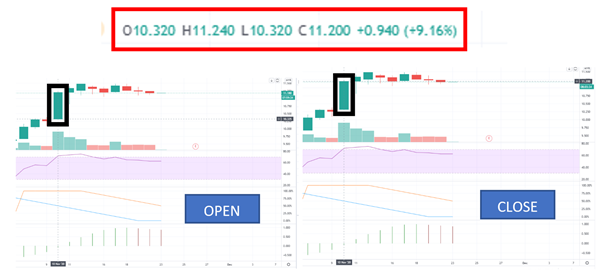
Now focus on the candlestick formation inside the black box.
On 10 November 2020, the stock opened at RM10.32 (image on the left) while the stock closed at RM11.20 (image on the right).
Because the close price is higher than the open price, a bullish candlestick is formed.
Bearish Candlestick
It occurs when the open price is higher than the close price.
Let me use a different counter as an example (refer to the image below).
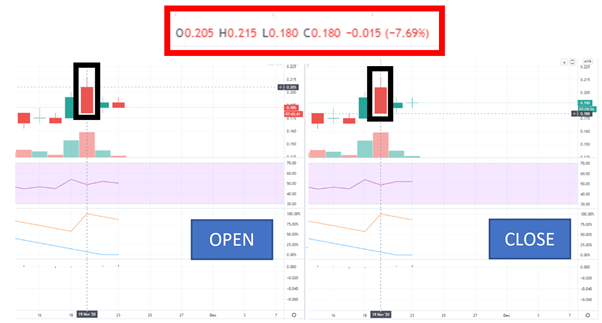
This time, focus on the candlestick formation inside the black box.
On 19 November 2020, the stock opened at 0.205 sen (image on the left) while the stock closed at 0.180 sen (image on the right).
Because the close price is lower than the open price, a bearish candlestick is formed.
Simple, isn't it? Hopefully you have learnt something new today.
Candlestick Patterns
Candlestick patterns consist of open, high, low, and close values displayed on a chart.
There are certain patterns that make candlestick patterns a powerful technique and strategy for analysing the market.
Some say there are dozens of patterns, others say there are hundreds — but do not worry, you do not need to memorise every type of pattern.
What we need is to understand the psychology behind candlestick patterns. That is a relief, right?
Importance of Candlesticks
1. Leading Indicator
There are various indicators in the trading world, and we can divide them into leading indicators and lagging indicators.
Lagging indicators mean that the price action or transactions on the chart occur first before we see movement on the indicator.
Leading indicators, on the other hand, attempt to predict future events and trends in the market.
2. More Visually Appealing Than Line or Bar Charts
We can visualise data beautifully — if the candle is profitable, it appears green or white; if it is a loss, the candlestick appears red or black.
3. Helps Create a Trading Plan Based on Candlesticks
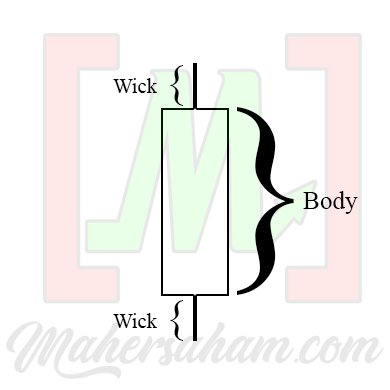
Candlestick Formation
1. Open, High, Low, Close
2. Shadow / Wick / Tail
3. Body
You can refer to the images below to identify the positions of Open, High, Low, Close, Shadow / Wick / Tail, and body.
Types of Candlestick Patterns
There are two types of candlestick patterns: simple and complex.
1. Single Candlestick
If you look it up on Wikipedia, you will find many types of single candlesticks. However, in this article, we will cover just two types.
These two types of single candlesticks are among the most important ones to understand.
- Doji (Indecision)
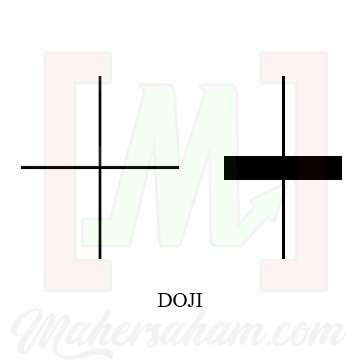
A Doji has no body — or if it does, the body is extremely small. Refer to the diagram above.
When you see a Doji candlestick, it means the market is uncertain.
Buyers and sellers, or demand and supply, are equally strong at that point. In simpler terms, bullish and bearish sentiment are roughly equal.
- Marubozu
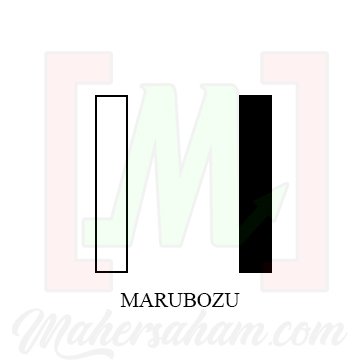
It indicates a strong candle and strong sentiment. Referring to the diagram above, a white or green candle signals strong bullish momentum, while a black or red candle signals strong bearish momentum.
2. Complex Candlestick
These are combination candlesticks formed from multiple single candlesticks.
Types of Patterns
1. Continuation (Maintaining the market direction)
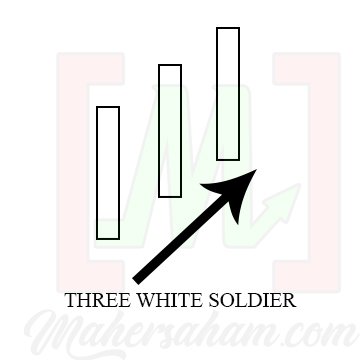
- Three White Soldiers (market uptrending)
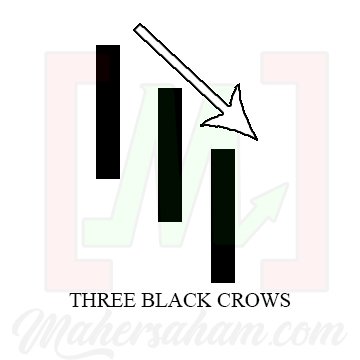
- Three Black Crows (market downtrending)
2. Reversal (Changing the market direction)
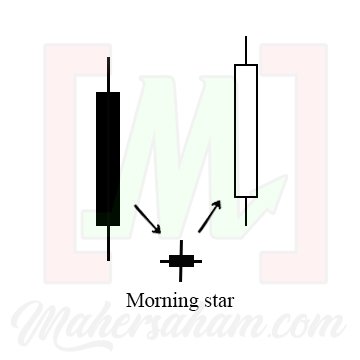
- Morning Star: changes direction from a downtrend to an uptrend.
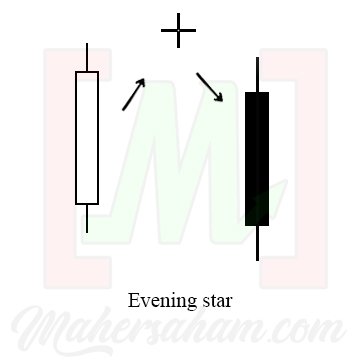
- Evening Star: changes direction from an uptrend to a downtrend.
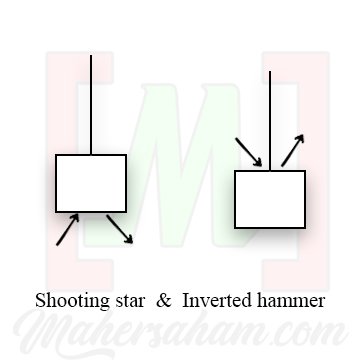
- Shooting Star: changes direction from an uptrend to a downtrend.
- Inverted Hammer (Gravestone and Dragonfly): changes direction from a downtrend to an uptrend.
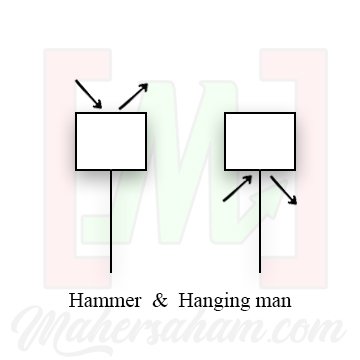
- Hammer: changes direction from a downtrend to an uptrend.
- Hanging Man: changes direction from an uptrend to a downtrend.
Combining With Indicators
1. Oversold and Overbought
Look for reversal patterns:
- Morning Star
- Evening Star
- Shooting Star
- Hammer
- Inverted Hammer
- Hanging Man
2. Momentum
Look for continuation patterns:
- Three White Soldiers
- Three Black Crows
We hope this has been useful!
You can also read the articles below to further understand candlestick analysis indicators:
History and importance of candlesticks
How to analyse stocks using 11 of the most powerful candlestick patterns
FAQ About Candlestick Analysis
What is candlestick analysis in stock trading?
Candlestick analysis is a method of reading stock charts that originated in 18th-century Japan. Each candlestick shows four key data points — open, high, low, and close — making it easier to visualise price movements and identify potential trading signals.
What is the difference between a bullish and bearish candlestick?
A bullish candlestick (green/white) forms when the close price is higher than the open price, indicating buying pressure. A bearish candlestick (red/black) forms when the close price is lower than the open price, indicating selling pressure.
What are the most important candlestick patterns for beginners?
Beginners should focus on Doji (market indecision), Marubozu (strong sentiment), Morning Star and Evening Star (reversal signals), and Three White Soldiers/Three Black Crows (continuation patterns). Understanding the psychology behind these patterns is more important than memorising every pattern.
Strengthen Your Investment Knowledge
Successful investing starts with solid knowledge.
Investment Basics:
Download our free ebook for a comprehensive guide.