How to Use Ichimoku Cloud Indicator on TradingView
Assalamualaikum and greetings to everyone.
Wishing you all good health and happiness with your loved ones.
Are you ready to learn more about stocks today?
Take a deep breath first.
Exhale…
May you find peace of mind.
Right, today we will learn about the Ichimoku Cloud Indicator.
As usual, we are still learning using TradingView.
What is the Ichimoku Cloud Indicator?
Ichimoku Cloud is a type of indicator used in technical analysis.
What are the advantages of this indicator?
This indicator can show several things at one time. Among them:
- Support and resistance
- Momentum
- Trend
There are several terms that you need to know.
Why?
So that it will be easier for you to do analysis in TradingView later.
What are those terms?
4 Key Terms in Ichimoku Cloud Indicator
- Tenkan (similar to 9-day moving average).
- Kijun (similar to 26-day moving average).
- Chikou (Price 26 days back)
- Kumo Cloud (Support and Resistance)
Ichimoku Cloud Indicator in TradingView
After you have logged in to TradingView, click on the chart section.
Then the display below will appear.
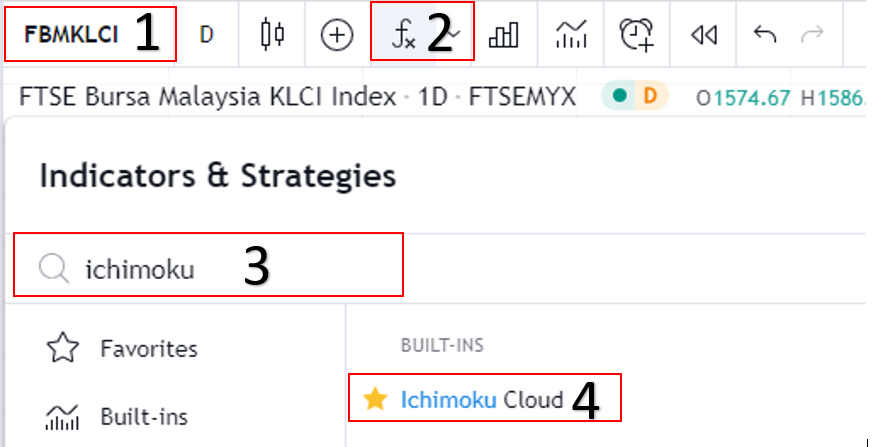
As shown in the image above, you can follow the steps stated.
- 1. Enter the name of the counter you want to study.
- 2. Click the indicator button
- 3. Type the indicator you want to use (Ichimoku Cloud for this time)
- 4. Click on that indicator
After that, your TradingView will look like this.
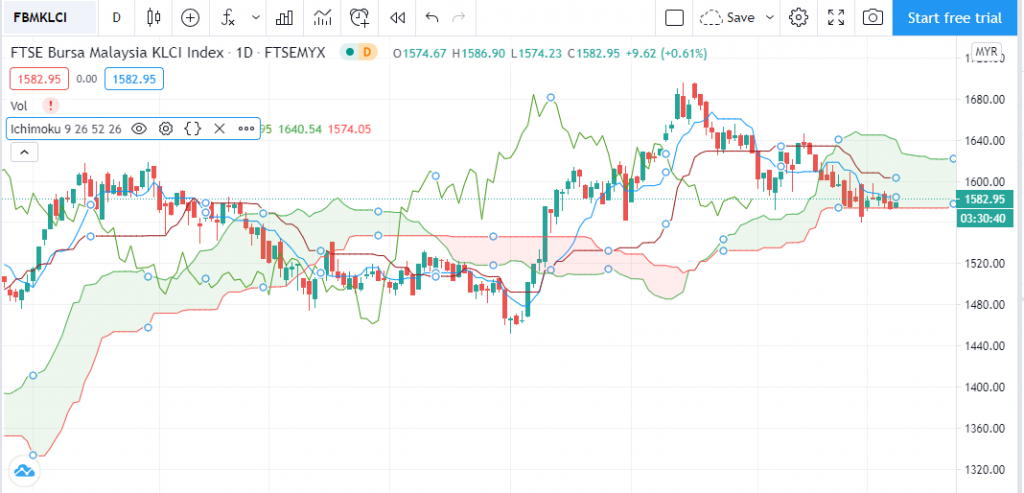
Looks confusing, right?
Relax.
There are steps to follow.
The first thing you need to know when using Ichimoku Cloud is the 4 terms I explained above.
So you need to take note of those things.
After that, you can read and study your counter.
- Tenkan (similar to 9-day moving average)
- -Fastest signal
- -If Tenkan is above Kijun, it is a bullish signal
2. Kijun (similar to 26-day moving average)
- -Can be used as a trailing stop
- -Can be used as moving support.
- -If price is above Kijun, it is a bullish signal
- -If price is below Kijun, it is a bearish signal.
3. Chikou (Price 26 days back)
- -If Chikou is above price, it is a bullish signal
- -If Chikou is below price, it is a bearish signal.
4. Kumo Cloud (Support and Resistance)
- -If price is above the Kumo Cloud, it is a bullish signal
- -If price is below the Kumo Cloud, it is a bearish signal.
- -If price is within the Kumo Cloud, it signals uncertainty.
Easy, isn''t it?
TradingView Is an Important Component of Technical Analysis
This article is one of the articles written in the Technical Analysis: TradingView series. Technical Analysis is one of the branches related to stock research.
There are many more topics covered in the technical analysis learning series and how you can use TradingView optimally to help you do research on stocks.
To see other topics related to TradingView or Technical Analysis, head to the Complete Technical Analysis Guide.
Conclusion
There are various indicators that exist in the world of stocks.
On the Mahersaham blog, we have prepared articles on various types of indicators.
You can read and understand these indicators.
Mahersaham has prepared the learning materials.
It is up to you whether to take this opportunity or not.
If you prefer watching videos,
follow Mahersaham on YouTube, and Mahersaham on Facebook to keep up with the latest stock information from us every day.
Let''s watch the video we have prepared.
Frequently Asked Questions (FAQ)
1. What is Ichimoku Cloud and how does it work?
Ichimoku Cloud (Ichimoku Kinko Hyo) is a comprehensive technical indicator that shows support, resistance, momentum, and trend direction in a single view. The cloud (kumo) is formed between two main lines.
2. How do you read Ichimoku Cloud signals?
When the price is above the cloud, it indicates a bullish trend. When the price is below the cloud, it indicates a bearish trend. A thick cloud indicates strong support/resistance.
3. What are the main components of Ichimoku Cloud?
Ichimoku Cloud consists of 5 components: Tenkan-sen (conversion line), Kijun-sen (base line), Senkou Span A and B (forming the cloud), and Chikou Span (lagging span). Each component provides different information.
4. Is Ichimoku Cloud suitable for beginners?
Although it looks complex, Ichimoku Cloud can be learnt gradually. Beginners can start by understanding the position of the price relative to the cloud to determine the basic trend before learning other components.
Want to improve your technical analysis skills? Open a CDS account with Mahersaham and start your investment journey. Also get our free stock basics ebook as a reference guide.