The Ichimoku Cloud as a Full System: Tenkan, Kijun, Kumo & Chikou Span
Many investors and traders in Malaysia first meet the Ichimoku Cloud as a "coloured cloud" floating over a stock chart. That is why so many people only watch the cloud and ignore the four other lines that are actually the backbone of the system. In reality, Ichimoku is not just one indicator - it is a complete system made up of five components that work together to show you trend, momentum, support, resistance and entry signals in a single glance.
In this article, we break Ichimoku down as a full system: Tenkan-sen, Kijun-sen, the Kumo (the cloud formed by Senkou Span A and B), and the Chikou Span. You will understand not only what each line is, but how all of them combine into one decision-making framework.
Quick Summary: The 5 Ichimoku Components
Before the details, here is the short answer for those who want the big picture first:
- Tenkan-sen (Conversion Line) - the average of the 9-period high and low. Shows short-term momentum.
- Kijun-sen (Base Line) - the average of the 26-period high and low. Shows medium-term trend and often acts as support/resistance.
- Senkou Span A (Leading Span A) - the average of Tenkan and Kijun, plotted 26 periods ahead.
- Senkou Span B (Leading Span B) - the average of the 52-period high and low, plotted 26 periods ahead.
- Chikou Span (Lagging Line) - the current closing price, plotted 26 periods behind.
The space between Senkou Span A and Senkou Span B is what forms the Kumo, or cloud. Together, all five components form what is known as Ichimoku Kinko Hyo.
What Is Ichimoku Kinko Hyo?
The full name of this system is Ichimoku Kinko Hyo, which literally means "one glance equilibrium chart". It was developed by a Japanese journalist named Goichi Hosoda before World War Two, refined over several decades, and formally published in 1969. According to Investopedia, the beauty of Ichimoku is that it is designed so a trader can assess trend direction and momentum at a single glance, without stacking many separate indicators.
The philosophy behind the name matters: "one glance" means you should be able to tell whether the market is rising, falling, or moving sideways within a few seconds. That is why all five lines exist - each answers a different question, but together they tell one consistent story.
Component 1: Tenkan-sen (Conversion Line)
Tenkan-sen is calculated using the formula: (9-period High + 9-period Low) / 2. Note that it is not an ordinary moving average using closing prices - instead it takes the midpoint between the peak and trough over the last 9 periods.
Because it only looks at 9 periods, Tenkan-sen moves quickly and is sensitive to recent price changes. It functions as a gauge of short-term momentum. When price is above Tenkan-sen, short-term pressure is bullish; when below, short-term pressure is bearish. The slope of Tenkan-sen also gives clues - a flat line signals that the market is moving in a range (sideways).
Component 2: Kijun-sen (Base Line)
Kijun-sen uses the same formula but over a longer period: (26-period High + 26-period Low) / 2. Because its window is longer, Kijun-sen moves more slowly and is more stable than Tenkan-sen.
Kijun-sen represents the medium-term trend and often acts as dynamic support or resistance. Many Ichimoku traders treat Kijun-sen as the "line of truth" - if price is far above it, the stock may be overbought and tends to pull back toward the Kijun. The crossover between Tenkan-sen and Kijun-sen (known as the TK Cross) is one of the most basic entry signals in this system, as we will discuss later.

Component 3: The Kumo - The Cloud (Senkou Span A & B)
This is the most famous part. The Kumo, or cloud, is formed by two lines projected forward 26 periods into the future:
- Senkou Span A = (Tenkan-sen + Kijun-sen) / 2, shifted 26 periods ahead.
- Senkou Span B = (52-period High + 52-period Low) / 2, shifted 26 periods ahead.
The area between these two lines is shaded, and that is the cloud. The Kumo has three functions. First, it shows the direction of the major trend: price above the cloud means an uptrend, price below the cloud means a downtrend, and price inside the cloud means an uncertain market. Second, the cloud acts as a thick zone of support and resistance - the thicker the cloud, the stronger the barrier. Third, because the cloud is projected 26 periods ahead, it gives you a "forecast" of where support/resistance may sit in the future.
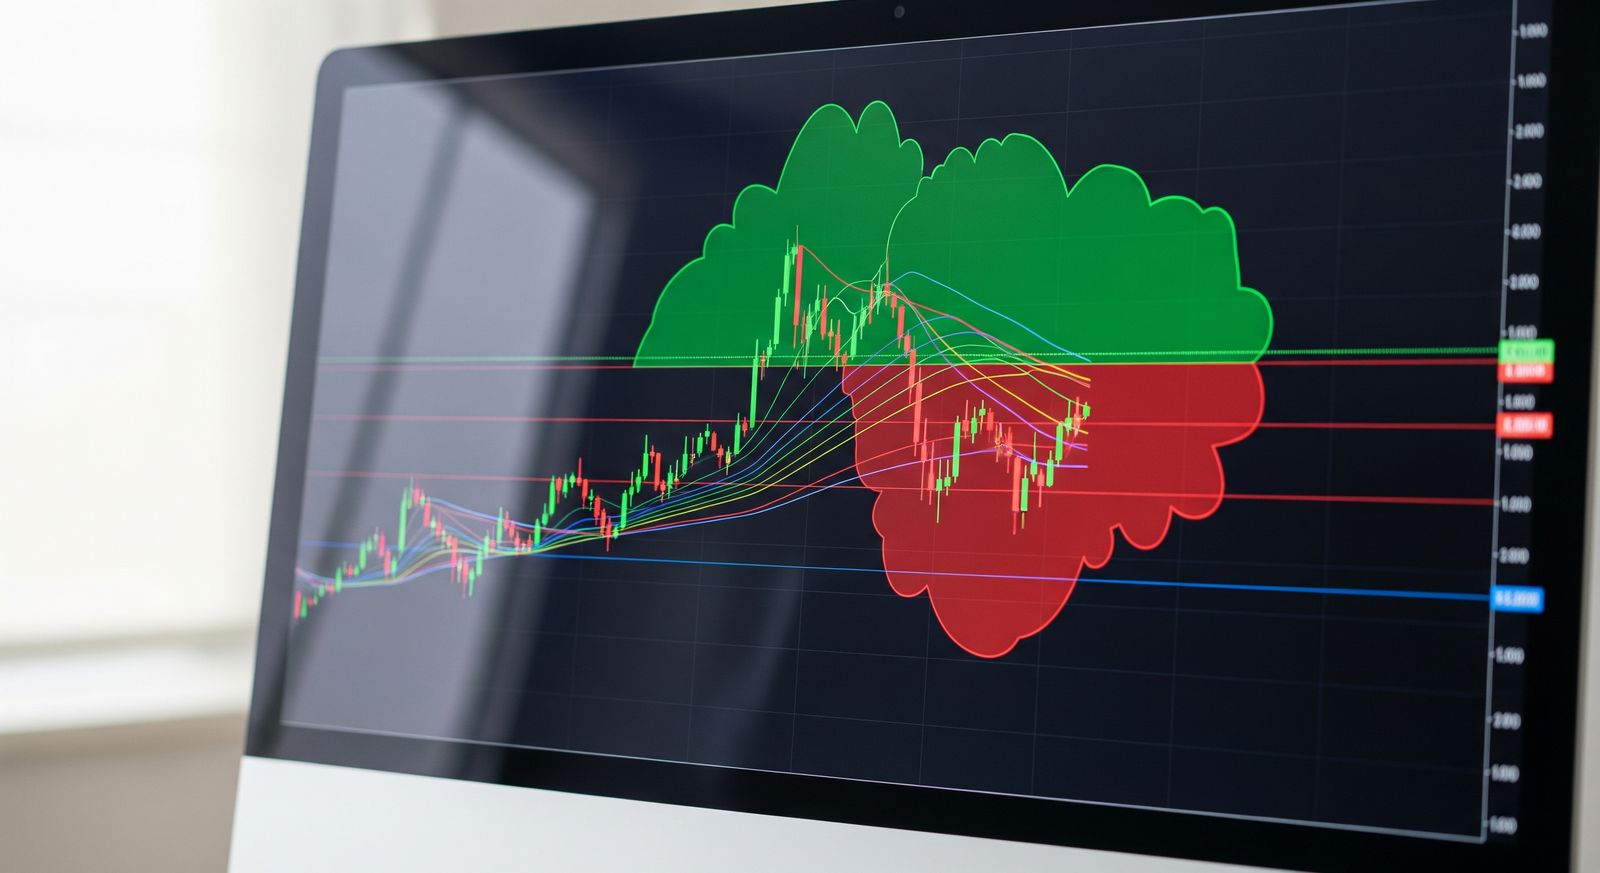
A unique feature is the Kumo twist - when Senkou Span A and B cross. This crossover signals a potential long-term trend change. According to the official TradingView documentation, the cloud's colour also changes depending on which line is on top: a green cloud when Span A is above (bullish) and a red cloud when Span B is above (bearish).
Component 4: Chikou Span (Lagging Line)
The Chikou Span is the most often ignored, but it is an important confirmation component. Its formula is the simplest: the current closing price, shifted 26 periods back. So the Chikou Span is really just today's price plotted 26 candles into the past.
Its purpose is to compare current momentum with past price. If the Chikou Span is above the price from 26 periods ago, it confirms bullish pressure. If it is below, it confirms bearish pressure. Many experienced traders will not take a signal unless the Chikou Span is also "clear" - that is, not stuck or overlapping with past price candles. This is an easy way to filter out false signals.
How the 5 Components Work as One System
This is where Ichimoku differs from other indicators. You are not meant to act on a single line alone. The strongest signals come when multiple components agree at the same time. Here is the complete checklist of a "buy" signal in the Ichimoku system:
- Price is above the Kumo - confirms the major trend is bullish.
- Tenkan-sen crosses above Kijun-sen (bullish TK Cross) - the momentum entry signal. This signal is stronger if it happens above the cloud.
- Chikou Span is above past price - confirms momentum is free of obstruction.
- The forward cloud (future Kumo) is green - signals that bullish support is expected to continue.
When all four conditions are met simultaneously, you have what Ichimoku traders call a "strong signal". For a "sell" signal, simply reverse each condition: price below the cloud, bearish TK cross, Chikou below past price, and a red forward cloud.
The core concept is equilibrium - back to the meaning of the name "Kinko Hyo". You want all elements of the system pointing the same way before taking a position. If Tenkan says buy but price is still below the cloud and the Chikou is stuck, that is not a safe signal. The system is designed to make you wait for full alignment, which naturally reduces the number of impulsive trades.
Using Ichimoku on Bursa Malaysia
Ichimoku can be applied to any Bursa Malaysia stock with enough liquidity and sufficient price history - you need at least 52 periods of data for Senkou Span B to be calculated accurately. For thinly traded second- or third-liner stocks, Ichimoku signals can become less reliable because of large price gaps and thin volume.
Platforms like TradingView offer the Ichimoku indicator for free with the standard 9/26/52 settings. If you are just starting out, we already have a step-by-step guide on how to use the Ichimoku Cloud indicator on TradingView that explains how to add it to your chart. Ichimoku is also most effective when used together with candlestick reading for extra confirmation at critical levels.
Keep in mind: the original 9/26/52 settings come from an era when the Japanese trading week was six days. Some modern traders adjust these settings, but the majority still keep the original values because they have become the industry standard and remain effective across many markets.
Ichimoku vs Ordinary Moving Averages
Many people equate Tenkan-sen and Kijun-sen with moving averages, but there is an important difference. An ordinary moving average calculates the average of closing prices over a period, so it leans toward the most recent price direction. Tenkan and Kijun instead calculate the midpoint between the highest and lowest price, making them more stable and less affected by a single extreme day.
As a result, the Kijun-sen often stays flat for longer than a 26-day moving average - and that flat line is actually a useful signal that the market is seeking equilibrium at that level. In addition, an ordinary moving average system does not give you the "forward-looking" element of the Kumo, nor the past confirmation of the Chikou Span. This is why Ichimoku is considered a more comprehensive system, even though it takes a little more effort to master. For a broader overview of various indicators, see our list of 22 essential technical analysis terms.
Common Ichimoku Mistakes
A few mistakes that frequently trip up new investors:
- Only watching the cloud - ignoring Tenkan, Kijun and Chikou means you only use part of the system and often miss the precise entry signal.
- Fighting the cloud trend - buying a stock sitting below a red cloud because it looks "cheap". Ichimoku is designed to trade with the trend, not against it.
- Ignoring the Chikou Span - taking a TK cross without confirming a clear Chikou often produces false signals in a sideways market.
- Using it on very small timeframes - on 1-minute or 5-minute charts, Ichimoku produces too much noisy signal. It is better suited to daily and weekly charts.
Pros & Cons of Ichimoku
Pros: Ichimoku provides a view of trend, momentum, support and resistance in a single display without stacking many indicators. It also provides a "forward-looking" element through the projected cloud, something rarely found in other indicators.
Cons: For beginners, an Ichimoku chart can look crowded and confusing because of the many lines. It also tends to produce lagging signals during a ranging market, and is less effective on low-liquidity stocks. Like all technical analysis tools, Ichimoku is not a crystal ball - it is a probability tool, not a certainty. For a comparison with other indicators, see our guide on the best trading indicators for beginners.
Frequently Asked Questions (FAQ) About the Ichimoku System
1. Is Ichimoku suitable for beginners?
Yes, but take time to understand each component first. Start by only looking at price position relative to the cloud before gradually adding Tenkan, Kijun and Chikou readings.
2. What do the 9, 26, 52 settings mean?
These are the number of periods used to calculate each line: 9 for Tenkan-sen, 26 for Kijun-sen and the cloud shift, and 52 for Senkou Span B. These values are the standard inherited from the Japanese market.
3. What is the difference between Tenkan-sen and Kijun-sen?
Tenkan-sen (9 periods) moves faster and shows short-term momentum, while Kijun-sen (26 periods) is more stable and represents the medium-term trend as well as support/resistance levels.
4. What is a TK Cross?
A TK Cross is the crossover between Tenkan-sen and Kijun-sen. A cross upward is a bullish signal, and downward is a bearish signal. It is stronger when it aligns with the price position relative to the cloud.
5. Why is the Ichimoku cloud green and red?
The colour shows direction: a green cloud means Senkou Span A is above Span B (bullish bias), while a red cloud means the opposite (bearish bias).
6. Can Ichimoku be used for Bursa Malaysia stocks?
Yes, especially on stocks with good liquidity and daily charts. Avoid low-liner stocks that are rarely traded because signals become less reliable.
7. Is Ichimoku enough to trade without other indicators?
Ichimoku is indeed designed as a complete system, but many traders still combine it with volume analysis and candlestick reading for extra confirmation.
Conclusion
The Ichimoku Cloud is not just a coloured cloud - it is a complete five-component system that works together to show trend, momentum, support, resistance and entry signals. When Tenkan, Kijun, Kumo and Chikou Span all point the same way, that is the real strength of this "one glance equilibrium" system.
The key to using Ichimoku successfully is patience: wait for full alignment before acting, and do not rely on a single line alone. Mastering technical analysis like Ichimoku takes practice on real charts - and the first step is having an account to start observing and trading.
To start investing and applying this technical analysis to real stocks, you need a CDS and trading account.
Open your CDS account to invest in Bursa Malaysia as well as overseas markets such as the US and Hong Kong.
You can also download our free stock market basics ebook to understand the fundamentals before you begin trading.