Market Outlook Guide: Mastering Global Sentiment & Stock Technical Analysis
Have you ever wondered why stocks on Bursa Malaysia suddenly drop even though there is no bad news domestically? Or why the oil and gas sector suddenly "explodes" even though the broader market looks bearish?
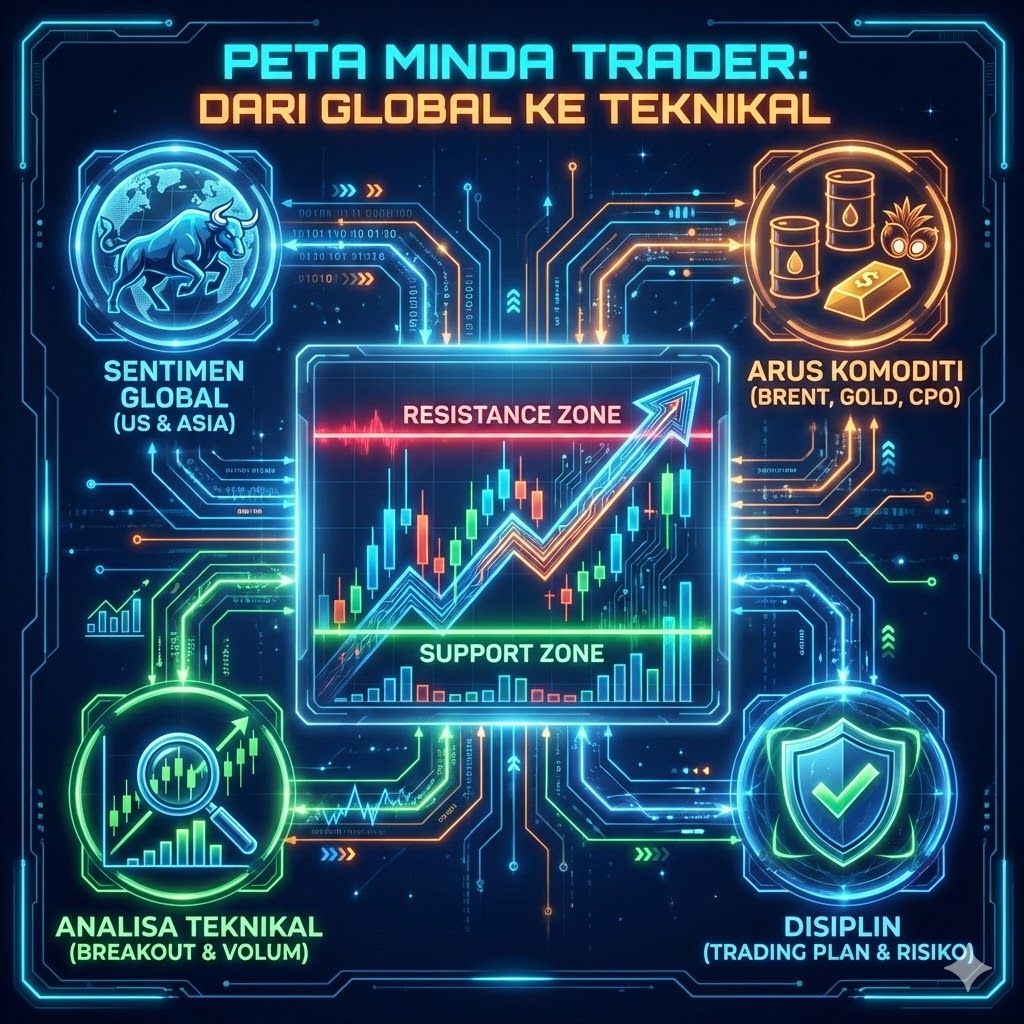
The answer lies in the connection between global markets, commodities, and chart psychology. As a smart investor or trader, we cannot look at just one angle. We need to see the big picture -- or The Big Picture.
In this article, we will dissect how global markets function and how you can use simple technical analysis to protect your capital.
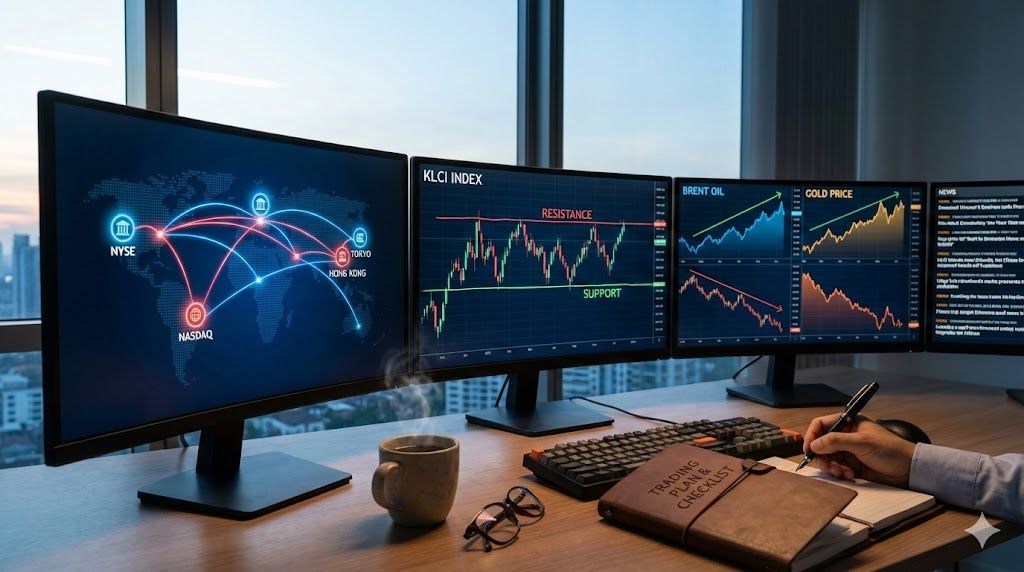
1. The Trader's Compass: Why Global Markets Matter
Today's financial world is deeply interconnected. What happens on Wall Street does not stay on Wall Street alone.
Dow Jones (United States)
The Dow Jones index is often regarded as the "father" of all stock indices worldwide. When the US market is in a bullish (upward) state, it sends a signal of confidence to investors around the globe. This positive sentiment typically spills over into Asian markets the following day. If the Dow Jones is strong, investor risk appetite generally increases.
Hang Seng Index (Hong Kong)
For us in Malaysia, the Hang Seng Index (HSI) is the primary proxy for assessing the health of the Asian economy and China's influence. A sideways movement in the HSI often signals that major investors are adopting a "wait and see" approach, perhaps waiting for significant economic data or new policy announcements.
2. Understanding the Pulse of Bursa Malaysia (FBM KLCI)
The FBM KLCI represents the 30 largest companies in Malaysia. However, there are times when our index appears "heavy" or weak even though overseas markets are green. Why?
This usually happens when the market lacks a strong local catalyst. In trader language, we often say the market is searching for a "Breakout".
What is a Breakout? It is a situation where the index or share price successfully breaks through a strong resistance level.
Why is the KLCI Weak? If the index fails to break through that resistance level, it means buying interest is still not strong enough to overcome selling pressure. In such conditions, traders are typically more cautious and opt for short-term swing trades only.
3. Riding the Commodity Wave: Oil, Gold, and Palm Oil
Besides indices, commodities are the "pulse" of many stock sectors on Bursa Malaysia.
Brent Oil & the Energy Sector
Global crude oil prices (Brent) have an almost direct correlation with Oil & Gas (O&G) sector stocks. When global oil prices rise strongly, oil service companies typically attract investor attention due to the potential for higher contracts and profits.
Gold as a 'Safe Haven'
Gold is a shelter. When the world is hit by geopolitical uncertainty or rampant inflation, investors shift their money from risky assets (stocks) to safe assets (gold). Therefore, rising gold prices usually reflect concern or a cautious stance in global markets.
CPO and the Plantation Sector
As one of the world's largest palm oil producers, Crude Palm Oil (CPO) prices heavily influence the performance of our plantation stocks. If CPO prices are weak, plantation stocks typically move sluggishly as well.
4. Technical 101: The Secret Behind Support & Resistance
If global sentiment is the "wind" that moves the ship, then Support & Resistance is the "map" for you to steer it. This is the most basic yet most powerful knowledge for a trader.
Resistance -- "The Ceiling"
Imagine bouncing a ball inside a room. The ball hits the ceiling and falls back down. In stocks, Resistance is the price level where selling pressure becomes so strong that it is difficult for the price to rise higher.
Trader Action: This is typically where people start taking profits (Take Profit).
Support -- "The Floor"
This is the price level where buyers are ready to step in. The price appears to be "supported" from falling further.
Trader Action: This is the zone where we watch for buying opportunities (Entry Point) because the price is considered cheap and low-risk.
Why Traders Must Know These Two Levels
Without knowing these levels, you are like driving on a highway without signboards. Traders use these levels to:
Determine Entry: Buy near Support.
Plan Exit: Sell near Resistance.
Manage Risk: If the price breaks below Support, that is the signal to Cut Loss before losses grow larger.
5. Conclusion: Becoming a Strategic Trader
Stock investing is not merely a guessing game of whether prices go up or down. It is a combination of understanding global news and reading chart psychology. When you see the US market is positive but Malaysia is still weak, you know you need to be more selective. When global oil prices rise, you know which sector to monitor. And with the help of Support & Resistance, you know where to "enter" and where to "exit" safely.
Remember, in trading, discipline is more important than emotion. Always update your trading plan based on the current market situation.
BONUS: Daily Trader Checklist -- From Pre-Market to Post-Market
Phase 1: Pre-Market Preparation (8:00 AM -- 8:55 AM)
Before the trading bell rings, you need to know which way the market wind is blowing.
Check US Markets (Dow Jones & Nasdaq): Did they close green (positive) or red (negative)? This will determine the early sentiment of the local market.
Monitor Commodity Prices:
Brent Oil: If rising, focus on Oil & Gas sector counters.
CPO: If strong, watch Plantation counters.
Gold: If surging, is the market worried (high risk)?
News & Corporate Announcements: Check if any company has released a quarterly report or new contract that could serve as a catalyst.
Screen Potential Counters: Use your favourite screener to find counters with high volume or attractive chart patterns.
Phase 2: Strategy Planning (Trading Plan)
"Failing to plan is planning to fail." Never "enter" without having your numbers ready.
Determine Support & Resistance (S&R): Where is the floor (buy price) and where is the ceiling (sell price)?
Calculate Risk Reward Ratio (Risk Reward Ratio): Ensure the potential profit is at least twice the potential loss (e.g. 2:1).
Set Entry & Exit Points:
At what price will I Buy?
At what price will I Take Profit (TP)?
At what price must I Cut Loss (CL)?
Determine Position Sizing (Position Sizing): How much capital will be used for a single counter? Never "All-In" on one counter alone.
Phase 3: During Trading Hours (9:00 AM -- 5:00 PM)
This is where emotions often interfere. Stay calm.
Be Patient Waiting for the "Setup": Do not chase prices (chasing price). Wait for the price to reach the Support zone or wait for a valid Breakout.
Monitor Volume: Is the price increase accompanied by strong volume? A rise without volume is usually a "trap".
Emotional Control: If the price does not move as planned, are you still following your original plan or starting to "pray" that the price will recover?
Cut Loss Discipline: If the price breaks below Support, exit without excuses. Capital is a trader's "lifeline".
Phase 4: Post-Market & Reflection (After 5:00 PM)
The process of becoming a better trader happens here.
Update Your Trading Journal: Record every trade made today. Why did I buy? Why did I sell? Did I profit or lose?
Analyse Mistakes: If there was a loss, was it due to a flawed plan or because I broke my own plan (emotions)?
Research Tomorrow's Counters: Look at counters that showed strength at closing to add to tomorrow's watchlist.
Summary Table
| Phase | Key Activity | Check |
|---|---|---|
| Pre-Market (08:00 - 08:55) | Monitor US sentiment (Dow Jones) & Asian markets. | |
| Check commodity price direction (Brent, CPO, Gold). | ||
| Read corporate news / latest catalyst. | ||
| Strategy (Before 09:00) | Determine Support & Resistance (S&R) levels. | |
| Set Entry, Take Profit (TP) & Cut Loss (CL) prices. | ||
| Calculate Position Sizing (How many units to buy?). | ||
| Trading (09:00 - 17:00) | Wait for price to reach Entry zone or Breakout. | |
| Watch volume (Rises must have volume). | ||
| Focus on original plan, ignore emotional distractions/FOMO. | ||
| Post-Market (After 17:00) | Record all transactions in Trading Journal. | |
| Analyse mistakes (Why profit? Why loss?). | ||
| Prepare Watchlist for tomorrow. |
Now that you understand how global market connections and chart analysis techniques work, it is time to translate that knowledge into real action.
Do not let this opportunity pass without proper preparation -- take your first step by opening a CDS trading account today to qualify for legitimate trading in the stock market.
To ensure you have a more robust and lower-risk trading system, join the S4N Class (Saham 4 Newbie) where we will guide you step by step until you can perform your own analysis with full confidence.
FAQ on Market Outlook & Technical Analysis
Q: Do I need to check global markets every single day before trading?
A: Yes, it is highly recommended. Global market sentiment (especially US markets) directly influences the opening direction of Bursa Malaysia. Spending 15-20 minutes on pre-market research can save you from costly mistakes.
Q: What is the difference between Support and Resistance?
A: Support is the "floor" -- a price level where buying pressure is strong enough to prevent further decline. Resistance is the "ceiling" -- a price level where selling pressure prevents further rise. These two levels form the foundation of technical analysis.
Q: How do commodity prices like oil and CPO affect Malaysian stocks?
A: Malaysia's economy is heavily linked to commodities. Rising Brent oil prices benefit O&G sector stocks, while strong CPO prices boost plantation counters. Tracking these commodities helps you identify which sectors are likely to perform well.
Q: Is technical analysis alone sufficient for trading decisions?
A: Technical analysis works best when combined with fundamental understanding and global sentiment awareness. Use chart patterns and S&R levels for timing, but always consider the broader market context before entering a trade.
Level Up Your Investment Knowledge
Knowledge is the first step. But without action, knowledge alone will not produce results.
Learn the Basics:
Download free Stock Market Basics Ebook for a complete beginner-friendly guide.
Start Investing:
To invest on Bursa Malaysia, Open a CDS Trading Account today.