Trading Guide: How to Use the RSI Trendline Breakout Strategy

In the world of trading, finding the right entry point is the key to profitability. Many new traders often get trapped buying at the peak or selling at the bottom. One popular and effective technique to avoid this problem is by combining Price Action (Trendline) with the momentum indicator known as RSI (Relative Strength Index).
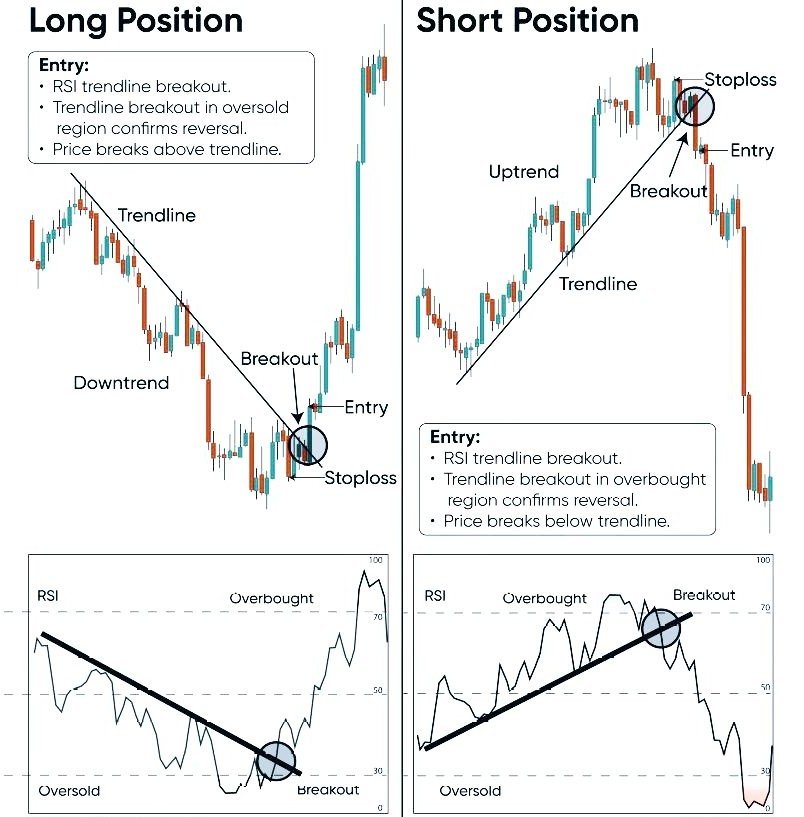
This article will break down the "RSI Trendline Breakout" strategy based on the technical chart above so that it is easy to understand for those of you who are just starting out.
Read More of Our Related Technical Analysis Articles:
- [Technical Analysis in the Stock Market Overview]
- [Complete Overview of Technical Analysis (TA)]
- [Three Fundamental Concepts in Technical Analysis]
What Is RSI and Trendline?
Before going further, understand these two basic concepts:
- Trendline: A line drawn connecting the peaks or troughs of price (candlestick) to identify the market direction, whether it is going up (uptrend) or down (downtrend).
- RSI (Relative Strength Index): An indicator used to measure the strength of price momentum.
- Overbought: Typically a reading above 70.
- Oversold: Typically a reading below 30.
This strategy uses a "Breakout" (line break) on both price and RSI as a signal to take action.
Long Position Strategy (Buy)
A Long position means you anticipate the price will rise. This technique is used when the market is in a downtrend and you are looking for a reversal opportunity (a change in direction upwards).
How to Identify the Setup
- Identify the Downtrend: The price is making a series of lower lows. Draw a descending trendline above the candlesticks.
- Draw Trendline on RSI: Look at the RSI indicator below the chart. Draw the same line on the peaks of the RSI graph.
- Wait for the Breakout Signal
- Main Condition: The RSI graph must break the RSI trendline first or simultaneously with the price.
- Validation Zone: This breakout is stronger if it occurs when the RSI is in the Oversold zone (below 30) or has just exited it. This indicates that sellers are exhausted and buyers are starting to enter.
- Confirmation: The price candlestick must break the price trendline and close above it.
Entry Point & Stop Loss
- Entry: Enter a "Buy" position as soon as the candlestick that breaks the trendline completes (closes).
- Stop Loss (SL): Place your SL slightly below the last candlestick low before the breakout occurred. This is to protect your capital if the price falls back.
Short Position Strategy (Sell)
A Short position is used in futures markets or stocks (if short selling is permitted) when you anticipate the price will fall.
How to Identify the Setup
- Identify the Uptrend: The price is making higher highs. Draw an ascending trendline below the candlesticks.
- Draw Trendline on RSI: Similarly, draw an ascending trendline on the troughs of the RSI graph.
- Wait for the Breakout Signal
- Main Condition: RSI breaks the RSI trendline downward.
- Validation Zone: This setup is very strong (high probability) if the break occurs in the Overbought zone (above 70). This indicates that buyers have run out of steam and sellers are starting to dominate the market.
- Confirmation: The price breaks the price trendline downward.
Entry Point & Stop Loss
- Entry: Enter a "Sell" or "Short" position after the candlestick breaks the trendline downward.
- Stop Loss (SL): Place your SL slightly above the last candlestick high before the breakout.
Why This Technique Is Suitable for Beginners
This technique is called the "Double Confirmation Strategy" because:
- You are not simply guessing the price direction.
- You wait for Two green lights: RSI (Momentum) break + Price (Price Action) break.
- It has clear Stop Loss rules, teaching risk management discipline.
Important Note: No strategy is 100% accurate. Always use proper money management and never risk money you cannot afford to lose.
FAQ — RSI Trendline Breakout Strategy
The RSI Trendline Breakout strategy is a technical analysis technique that combines price action with the RSI momentum indicator.
It is used to detect changes in market direction (reversal) earlier by observing a trendline break on the RSI chart before or simultaneously with the actual price breakout.
The best time for a Long position is when the market is in a downtrend, and the RSI line breaks its descending trendline while in the Oversold zone (below a reading of 30).
Entry is made after the price candlestick also breaks the price trendline and closes above it.
A Short setup is identified when the market is in an uptrend and RSI is in the Overbought zone (above a reading of 70).
A sell signal appears when the RSI line breaks the ascending trendline downward, followed by the price breaking its trendline (support) downward.
For a Long position, the Stop Loss (SL) should be placed slightly below the lowest price (swing low) of the last candlestick before the breakout.
For a Short position, the SL is placed slightly above the highest price (swing high) of the last candlestick before the break occurred.
This is to minimise risk in case a false signal (fakeout) occurs.
Combining RSI with Trendline provides "Double Confirmation".
The Trendline shows the current price direction, whilst RSI shows the strength of momentum behind that movement.
This combination helps filter out false signals and increases entry accuracy compared to using only a single indicator.
Aspire to Become a Full-Time Trader?
Want to beat the market and achieve returns higher than ASB?
With the skills and expertise you learn here, you can achieve returns higher than ASB. Make the most of your savings now!
From Intraday Trading, Swing Trading, Scalping, to Value Investing — you can apply whichever style suits your schedule.
Learn through our Gold Package, a learning module that has produced many stock investment experts. Subscribe Now:

Enhance Your Investment Knowledge
Successful investing begins with solid knowledge. Continue your learning journey.
Investment Basics:
Want to learn from the basics? Download our free ebook for a complete guide.
Open a CDS Account:
Ready to start? Open a CDS account and put what you have learnt into practice.
Read Also:
Discover the 10 dividend investor mistakes you need to avoid.