Understanding Support and Resistance Concepts Made Easy
Support and resistance are fundamental concepts that everyone must understand before delving into the world of stocks.
What Is Support?
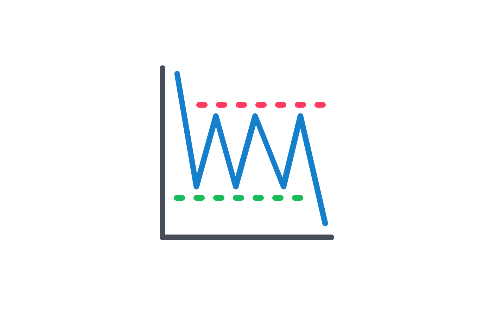
Support is a price level where the price stops falling and bounces upward. It is the level at which sellers can no longer push the price down because buyers are trying to take control of that level to push the price higher.
For example, if the price drops and hits a support level, then bounces back up, that is considered a strong support level.
What Is Resistance?
Resistance is a price level that acts as a barrier preventing the price from rising further. If the price breaks through resistance, it will continue to rise. If it fails to break through, it will fall back to find support.
This means that when the price rises and hits a resistance level, it must first break through that barrier.
As long as this barrier or wall is not successfully broken, the price will bounce back down and attempt to break through the resistance again until it finally succeeds.
The Concept of Support and Resistance
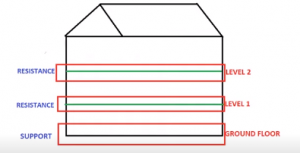
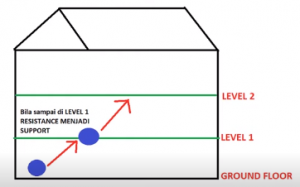
To understand support and resistance more easily, let us use the concept of a house. This house has 3 levels (Ground Floor, Level 1, and Level 2).
The Ground Floor serves as the support – it is the solid foundation of the house. This foundation is called support. Similarly in stocks, it means the support price level must be strong.
If the stock price breaks through support, it will fall underground.
Your house might even collapse entirely. That is why the foundation of a house is a solid floor. The same applies to stock prices.
Level 1 and Level 2 are resistance levels or strong barriers. In the context of a house, this means we need to break through the barrier above us – our ceiling.
Next, let us use the example of a ball. Imagine throwing a ball at the ceiling.
The ball will bounce back down to the floor, right? That is the concept of support and resistance.
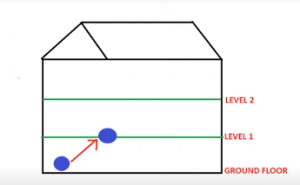
The concept is this: when the ball fails to break through the ceiling, it will bounce back down to find strong support before bouncing back up again.
The same applies in stocks – when there is no momentum, the stock will fall to find support first before making a pullback to rise again.
Resistance Becomes 'New Support'
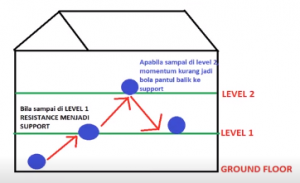
But if the ball we throw does not bounce back down because our throw was strong enough to break through the Level 1 ceiling.
What we need to understand here is that once it breaks through, resistance becomes 'New Support' – or as it is commonly known, 'Resistance Become Support' (RBS).
We now know that Level 1 has become RBS.
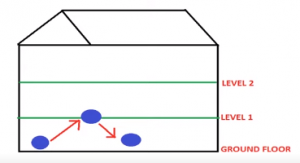
Then we throw the ball again to try to break through Level 2. But the Level 2 ceiling concrete is too strong, so the ball will bounce back down to find support at Level 1.
After the ball has bounced many times trying to break through the resistance, it will eventually succeed in breaking through Level 2.
Level 2 will then become RBS, just like the process of breaking through Level 1 earlier.
This pattern repeats itself in stocks. That is why you often hear the saying 'History repeats itself'.
It means that stock price movements tend to follow the historical patterns of what has previously occurred with that company's share price.
For those who do not yet have a CDS account, why not register for a CDS account with Mahersaham and you can join exclusive classes for Mahersaham clients.
Conclusion
The concept of support and resistance is extremely important for us to thoroughly understand because with support and resistance, we can gauge the potential for a stock's price to rise further or fall.
You can watch the support and resistance video that we have prepared.
We hope this is beneficial!
Frequently Asked Questions (FAQ)
What is the difference between support and resistance?
Support is the price level where a stock stops falling and bounces upward due to buying pressure. Resistance is the price level where a stock stops rising and reverses downward due to selling pressure. Together, they form the fundamental framework for technical analysis.
How do I identify support and resistance levels on a chart?
Look for price levels where the stock has repeatedly bounced off (support) or been rejected from (resistance). The more times a price level has been tested, the stronger it is. You can draw horizontal lines at these levels on your chart to visualise them clearly.
What happens when resistance becomes support?
When a stock price breaks through a resistance level with strong momentum, that former resistance level becomes a new support level. This is known as Resistance Become Support (RBS). The price will now use this level as a floor to bounce upward from.
Can support and resistance be used for Bursa Malaysia stocks?
Yes, support and resistance concepts are universal and work for all stock markets including Bursa Malaysia. These are fundamental technical analysis principles that apply regardless of which market or stock you are analysing.
New to Stock Investing?
Want to learn about stocks? Want to know more?
But do not know where to start?
Do not worry – download the FREE Mahersaham ebook right now!