How to Use Volume Price Analysis in Stock Research

A Complete Guide to Volume Price Analysis is a book recommended by Tuan Maher (Founder of Mahersaham and Remisier at Mplus) for those who wish to deepen their knowledge of volume price analysis.
According to Tuan Maher, this book has greatly changed his perspective on volume in the stock market. Elaborating further on the book, he says he will always use volume in every analysis he conducts.
Every time Tuan Maher opens any stock chart, he never forgets to look at the volume section.
This book also tells the story of how Charles Dow (creator of Dow Theory), Jesse Livermore (American stock trader), and Richard Ney (investment counsellor) used volume price analysis.
All three of them used volume and price to predict where the market was heading. Through this method, they built enormous wealth.
At that time, they used ticker tape to observe price volume analysis. However, nowadays we use trading screens.
If you separate volume and price and only look at a single day, it gives no meaningful information and no pattern is formed.
However, when you combine volume and price and observe them over several days or weeks, a pattern will form.
This pattern can be used to predict where the market is heading.
Will the market rise or fall?
3 Key Elements of the Stock Market
In any form of investment, there will be important elements. In the stock market, these key elements are:
- 1. Price
- 2. Volume
- 3. Pace/Momentum (Can be observed using indicators.)
Groups in the Investment World
There are two groups that participate in the investment world. The first is the minority group and the second is the majority group.
Minority Group
- Large funds
- Institutional funds
- Smart money
- Sharks (Jerung)
- Syndicates
- Market maker operators
Majority Group
- Retail investors who are trapped
- Those who are still unclear about their analyses
- Those who are still exposed to fear & greed emotions
But did you know that the group that consistently makes profits is the minority group?
This is simply because the minority group does the opposite of what the majority group does.
You must be wondering, what exactly does this minority group do that enables them to consistently profit?
That is one of the reasons why we want to learn about volume price analysis.
We want to know what the minority group is doing.
3 Basic Laws of Wyckoff
In the book Price Volume Analysis, we are introduced to 3 basic laws of Wyckoff (Supply & Demand, Cause & Effect, Effort vs Result) as the foundation for understanding volume price analysis.
Who is Wyckoff? Richard Wyckoff was known as a Supertrader and Educator in the early 1900s, and he also emphasised the existence of a market structure.
1. Supply & Demand
What drives market prices is supply and demand.
When supply is low, demand will be high. Therefore, stock prices will rise because many people want to buy.
Have you noticed that when supply is low, it becomes rare and people scramble and are willing to pay a premium to get something that is rare?
When supply is high and demand is low, then the stock price will fall because not many people want to buy.
And those who bought with the intention of making a profit will start to feel give up, and then they will sell at a lower price. This is because they initially assumed the stock price would rise.
But once they have bought the stock and nobody else wants to buy it, they become desperate to sell because they have already invested a sum of capital in that purchase.
Because of this, they are willing to sell at an even lower price. And everyone else also decides to sell at a low price in order to liquidate. This is what causes stock prices to fall.
2. Cause & Effect
In the stock market, cause and effect tell us that to produce a big effect, there must be a big reason behind it.
So, for a price to rise or fall significantly, we need a substantial amount of volume that is proportional to what is happening to the price.
From a technical standpoint, it is impossible for a stock price to rise significantly without something substantial happening beforehand.
That something substantial could be a project announcement or the company performing well in terms of fundamental analysis.
In volume price analysis, what is meant by cause is the existence of a continuous effort that has been ongoing over a long period of time.
Once that process is complete, the stock price will surge.
After the stock price surges, most people wonder how it could have happened so suddenly.
However, what we do not realise is that this process started long ago, where Smart Money had been collecting the stock over a long period (some wait between 6 months to 2 years).
Compared to the length of their waiting period, it is only fair that the stock price increase brings them profit.
3. Effort vs Result
For something to produce a significant price change, it requires continuous effort.
As the Malay proverb goes, 'effort is the stairway to success'.
5 Concepts of Volume Price Analysis
These phases are continuous processes carried out by either Syndicates or Smart Money.
- 1. Accumulation
- 2. Distribution
- 3. Testing
- 4. Selling Climax (Buying climax occurs at the market high)
- 5. Buying Climax (Selling climax occurs at the market low)
Accumulation Phase
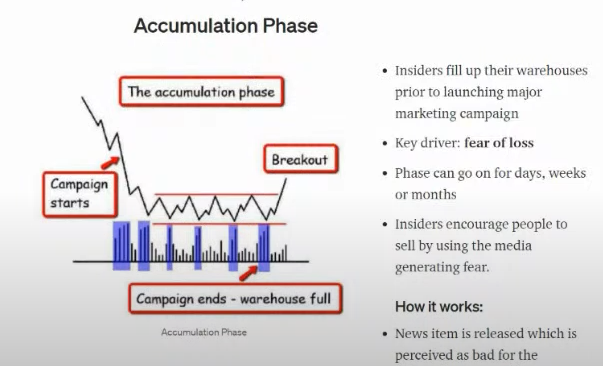
The accumulation phase is a sideways phase where Smart Money or Syndicates are busy collecting stocks.
And they will collect as much as possible.
Once they have accumulated as much as they can, they are the ones who will determine the stock's price movements.
What they will do is break out and release the supply little by little into the market. (Refer to the diagram above)
Once they feel it is time to take profit, they feel they have made enough and the campaign is over, the next phase will begin — the distribution phase.
Distribution Phase
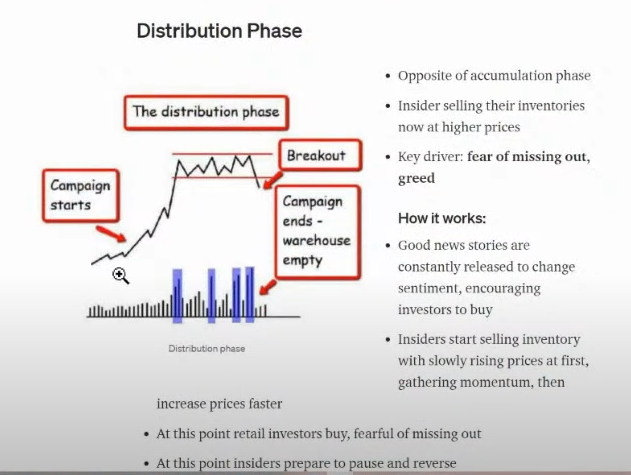
In this phase, there is also a sideways movement, and the market direction is still uncertain at this point.
During this sideways phase, buyers and sellers are battling against each other.
Whoever wins will determine the market direction.
If the seller wins, the seller will distribute. So when the seller has distributed to retailers (ordinary retail investors like us) and the retailers are holding all the stock with no more Large Funds, Syndicates or Smart Money holding those shares (they no longer care about that stock), what happens to the stock price?
Naturally, the stock price will fall. Because retail investors do not have the capacity to determine stock price movements.
This is because retailers or ordinary retail investors like us are primarily exposed to emotions.
Secondly, retailers buy stocks in small quantities because there is no reason for retailers to buy in large quantities.
Normal vs Anomaly in Volume & Price
Normal
1. Single Candle
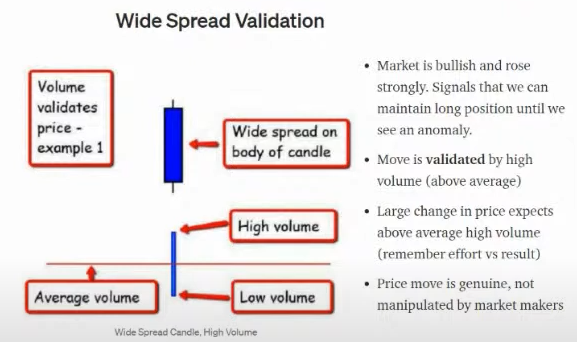
Normally, when a candlestick is small, the volume will be small, and when a candlestick is large, the volume will be large.
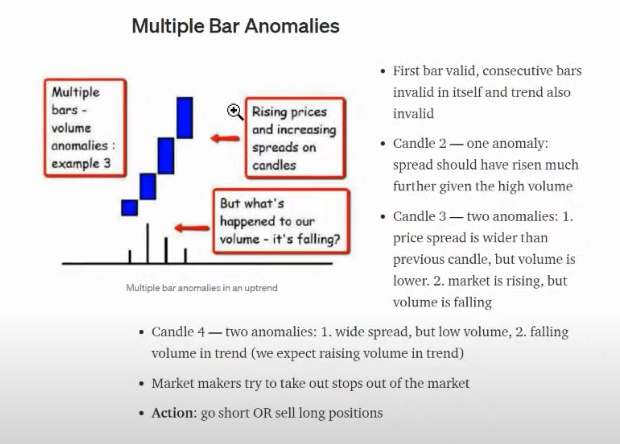
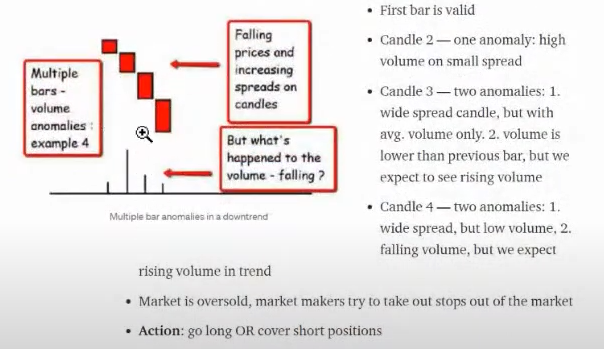
2. Multiple Candles
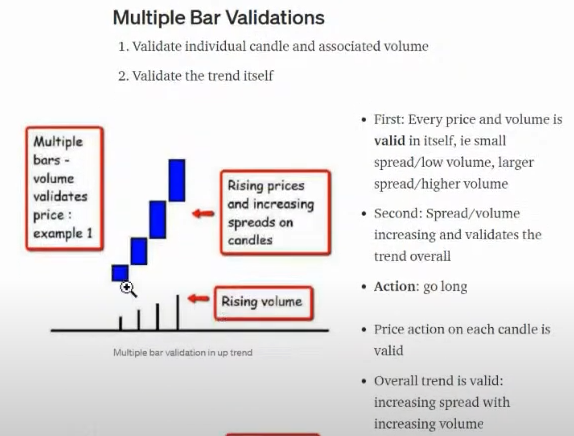
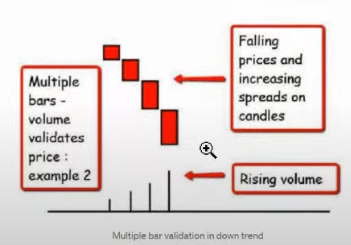
A rise or fall in stock price should be supported by volume.
If the price keeps rising, then volume should also keep rising. And if the stock price keeps falling, then volume should also keep declining.
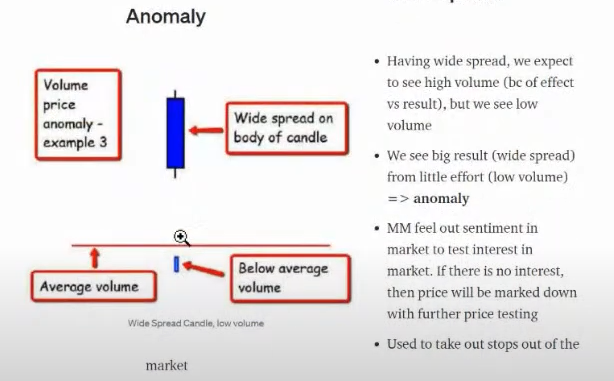
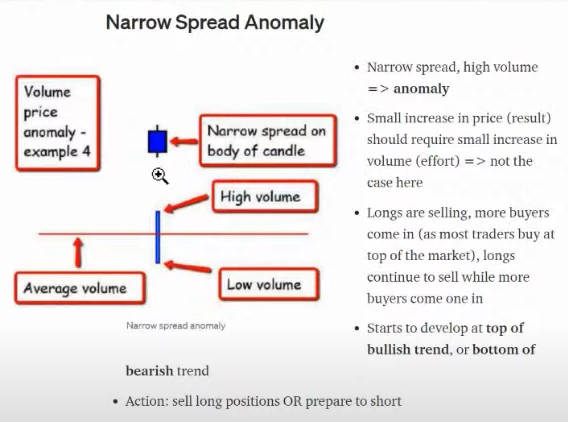
Anomaly
In volume price analysis, we are actually looking for something abnormal, or what we call an anomaly.
An anomaly occurs when the candlestick is small but the volume is large, and conversely when the candlestick is large but the volume is small.
And this anomaly exists in the accumulation phase and the distribution phase.
You can refer to the diagram below.
Let us look at the analysis steps.
1. Analyse each price candle: look for validation or anomaly using volume
2. Analyse new price candle against context of last few candles: look for validation of minor trends or possible reversals
3. Analyse complete chart: Where is the price in terms of any longer term trend?
After detecting anomalies in single candles and multiple candles, we next need to look at the overall chart picture.
For example, by now many anomalies have occurred in both single candles and multiple candles.
Then we need to look at the bigger picture — where is the stock currently? At the top or the bottom?
Typically, if the stock is at the bottom, then an accumulation process is taking place.
If the stock is at the top, then a distribution process is taking place.
We hope you find this useful!
Frequently Asked Questions (FAQ)
What is Volume Price Analysis (VPA) and why is it important?
Volume Price Analysis is a technical analysis technique that combines trading volume data with price movements to understand the true strength behind market movements. VPA helps investors identify whether price movements are supported by strong volume or are merely false movements.
How do you read the relationship between volume and candlestick price?
If the price rises with high volume, it indicates strong buying interest. If the price rises but volume is low, it may signal weakness and potential reversal. The anomaly between volume and price provides crucial clues about the actions of big players in the market.
What is the difference between the accumulation and distribution phases in VPA?
Accumulation occurs when big players (smart money) quietly collect stocks at low price levels before driving the price up. Distribution occurs when they sell their holdings at high price levels. Both phases can be identified through specific volume and price patterns.
Can VPA be used together with other technical analysis techniques?
Yes, VPA is highly effective when combined with other techniques such as support and resistance, candlestick patterns, and moving averages. This combination provides a more comprehensive view of market conditions and improves the accuracy of trading decisions.
Ready to start your stock investing journey? Open a CDS account with Mahersaham now.
Get the free Stock Basics Ebook to learn the fundamentals of stock investing from scratch!
Further reading: