How to Use Volume in Stock Analysis on Bursa Malaysia

Volume is the total number of shares traded on BURSA MALAYSIA. It can be viewed for 30-minute, daily, weekly, and monthly timeframes depending on the type of TRADER/INVESTOR.
On a chart, it appears below the CANDLESTICK chart. It is commonly used to identify the trend of a particular stock.
Volume is very important in the stock market because TRADERS/INVESTORS analyse stocks using TECHNICAL ANALYSIS.
During their analysis process, volume movement is one of the most important factors used to confirm EP (ENTRY POINT), TP (TAKE PROFIT) & CL (CUT LOSS).
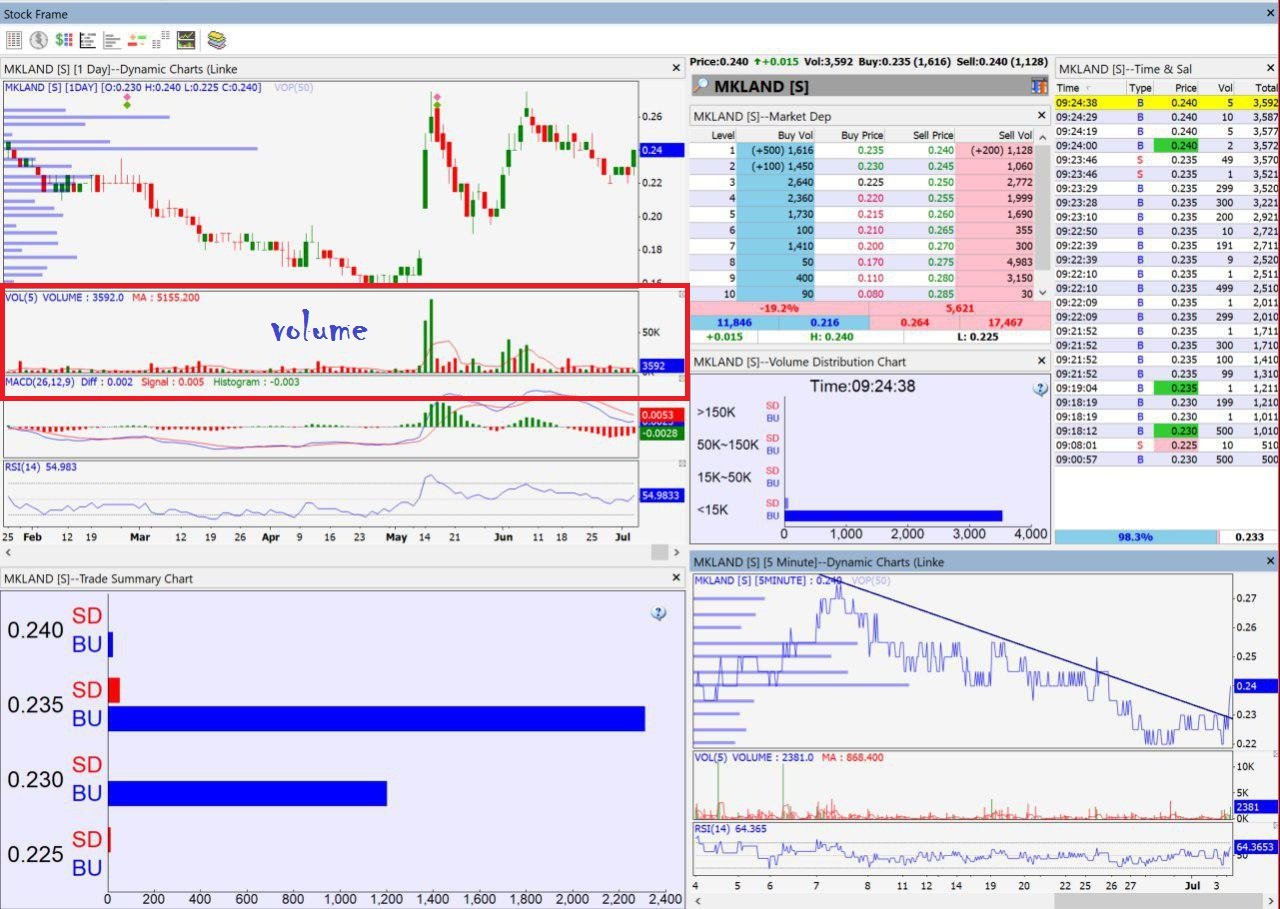
The example above is from SHARE INVESTOR used by the Mahersaham team for the MKLAND counter (for educational purposes only).
The red box shows the VOLUME for this counter. You can ignore the rest for this session, but anyone using SHARE INVESTOR will find it excellent because of its many features.
Want to know more? Visit /akauncds
How to Detect Volume
It is quite simple. For example, Counter A typically has about the same trading volume throughout the month. However, one day COUNTER A's VOLUME is significantly different from the norm.
From there, we can tell that there are TRADERS/INVESTORS or even SHARKS (INSTITUTIONS) who are interested in this counter.
So we can ride along to take advantage of the opportunity. That is the benefit of using this method.
However, remember that volume comes in two colours: RED & GREEN. Do not assume that just because there is volume, profits are guaranteed.
IF RED — it means TRADERS/INVESTORS are selling.
In simple terms: RUN!
IF GREEN — it means TRADERS/INVESTORS are buying. In simple terms: the stock is about to rocket!
Lastly, you need to understand that VOLUME leads PRICE. TRADERS/INVESTORS will monitor the volume to see if a REVERSAL might occur due to various factors.
This means that any VOLUME — whether RED or GREEN — will cause a CHANGE IN PRICE.
Here is a simple example as shown in the diagram below: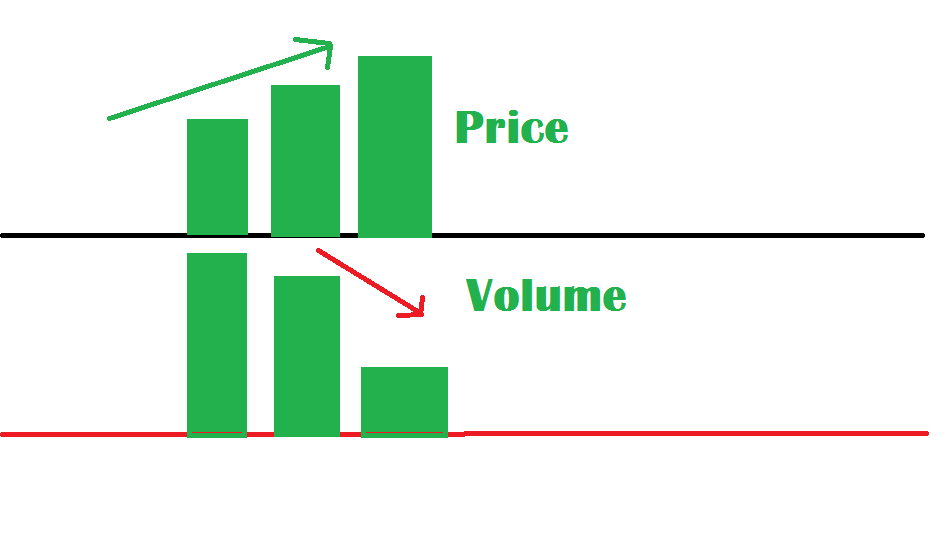
Looking at the price, the trend is upward, but the volume is decreasing. This is what is known as a REVERSAL that may potentially occur in the PRICE.
The PRICE will drop because the BUY VOLUME is getting thinner while the SELL VOLUME is getting thicker.
FAQ (Frequently Asked Questions)
What is trading volume in stocks?
Trading volume refers to the total number of shares traded during a specific period on Bursa Malaysia. It can be viewed across different timeframes — 30 minutes, daily, weekly, or monthly — and is displayed as bars below the candlestick chart on trading platforms.
Why is volume important in technical analysis?
Volume is crucial because it helps confirm the strength of price movements. Traders and investors use volume to validate their entry points (EP), take profit levels (TP), and cut loss levels (CL). A price movement supported by high volume is considered more reliable than one with low volume.
How do I detect unusual volume in a stock?
Compare the current day's volume with the stock's average volume over the past month. If the volume is significantly higher than usual, it could indicate that institutional investors (also known as "sharks") or large traders are taking an interest in that particular counter.
What does red and green volume mean?
Green volume bars indicate buying pressure — more traders are buying the stock. Red volume bars indicate selling pressure — more traders are selling. It is important to look at the colour of the volume and not just the size, as high volume alone does not guarantee the stock price will rise.
What does "volume leads price" mean?
This means that changes in volume often occur before changes in price. For example, if a stock's price is trending upward but volume is decreasing, this divergence signals a potential reversal — the price may soon start to fall as buying interest weakens.
Interested to Learn More About Stock Investing on Bursa Malaysia?
Want to Buy and Sell Stocks but Don't Have a CDS Account Yet?
What are you waiting for? Register a CDS account with Mahersaham and you can join exclusive classes for Mahersaham clients.