4 Key Criteria of Technical Analysis in the Stock Market
What Is Technical Analysis
Technical analysis is one of the research methods in the financial world used to forecast stock price movements.
Whether stock prices will go up or down.
At Mahersaham, there are 4 criteria that we emphasise to our students and clients in our research.
These criteria are:
- •Trend
- •Support & Resistance
- •Risk Management
- •Trading Plan
Trends You Must Know
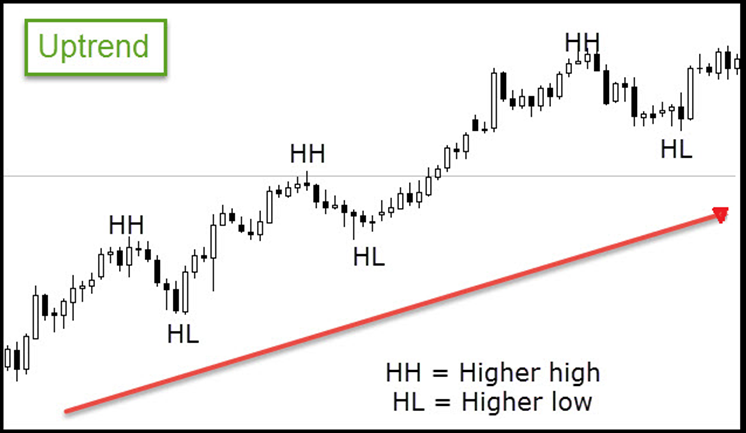
Uptrend
A counter that consistently rises by creating new higher highs.
Combination of:
- •HIGH
- •LOW
- •HIGHER HIGH (HH)
- •HIGHER LOW (HL)
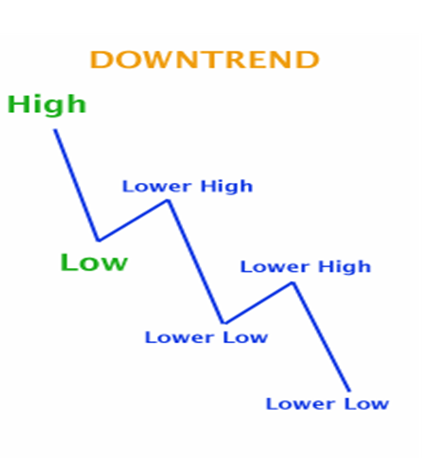
Downtrend
A counter that consistently makes new lows.
Remember that for a downtrend, each new high is always lower than the previous high.
Combination of:
- •HIGH
- •LOW
- •LOWER HIGH (LH)
- •LOWER LOW (LL)
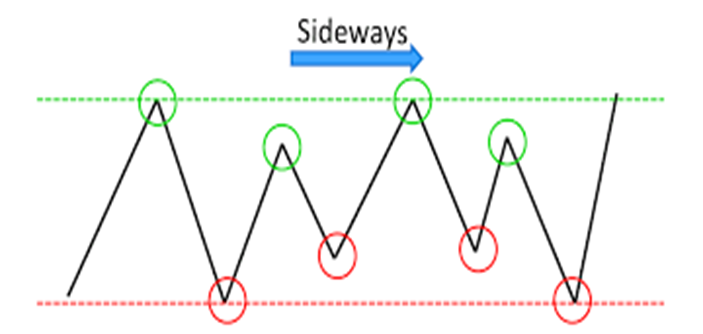
Sideways
- Only has HIGH and LOW
- Uncertain direction
Support and Resistance in Technical Analysis
You need to identify support and resistance levels.
There are many ways to do this, for example using trendlines, Gann, or manually following candlestick movements.
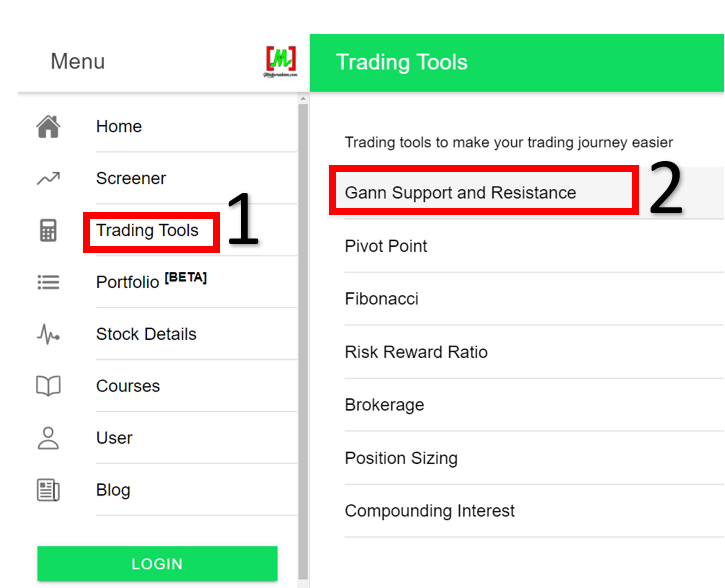
If you want to use Gann, it is quite straightforward.
Simply visit app.mahersaham.com and log in, then follow the steps below.
Read these articles for a better understanding of support and resistance.
- How to Easily Understand the Concept of Support and Resistance
- How to Draw and Determine Support and Resistance
Risk Management
Risk cannot be avoided, but it can be managed.
The way to do this is by setting a risk-reward ratio.
Determine your loss ratio versus your profit ratio.
Every time you want to invest, sell, or buy a stock, make sure you calculate your loss ratio versus your profit ratio.
Our recommendation is (1:2) or (1:3).
However, if you can calculate for an even higher profit, that is even better.
How do you calculate it?
It depends on your capital.
For example, if you have RM 10,000, before investing you need to determine how much you are willing to lose and how much you want to profit.
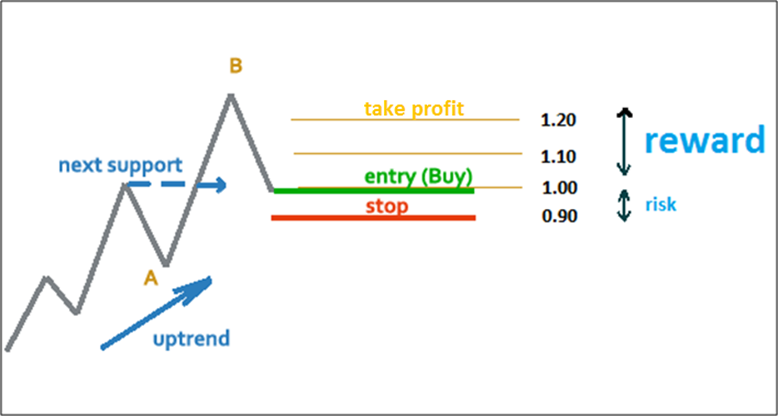
For example, if you want to limit your maximum loss to RM 200 and your minimum profit target is RM 400, then the ratio is:
Loss ratio : Profit ratio = RM200 : RM400
So your ratio is (1:2).
Remember, the ratio depends on how much you are willing to lose first, only then can you think about how much you want to profit.
Trading Plan
With a trading plan, you will know exactly what to do.
Before buying any stock, you would have already determined what percentage of profit you want to take and what percentage of loss you are willing to bear if the stock price drops.

With a trading plan, you already know where to set your entry price, target price, and cut loss.
So you will not be left wondering what to do next. You simply need to follow the trading plan that you have already set.
Want to Learn More About Technical Analysis?
You can read more here
What Is Technical Analysis
- Technical Analysis, What Is It?
- What Is Technical Analysis?
- Fundamental Analysis VS Technical Analysis
- Support and Resistance for Technical Analysis Studies
FAQ
What is technical analysis in stock investing?
Technical analysis is a method of studying the stock market that uses price charts, trading volume, and technical indicators to forecast future stock price movements. It differs from fundamental analysis, which examines a company''s financial performance.
What are the 4 key criteria in technical analysis?
The four key criteria in technical analysis are trend (direction of price movement), support and resistance (support and resistance levels), trading volume (the number of shares traded), and trading plan (trading planning including entry price, target price, and cut loss).
Is technical analysis suitable for new investors?
Yes, technical analysis is highly suitable for new investors as it provides clear guidance on when is the right time to buy and sell stocks. By understanding the basics such as support, resistance, and trend, new investors can make more disciplined investment decisions.
Why is a trading plan important in technical analysis?
A trading plan is important because it helps you set profit targets and loss limits before buying a stock. With a trading plan, you know where to set your entry price, target price, and cut loss, so you do not make decisions based solely on emotions.
Ready to start investing in stocks with more confidence? Open your CDS account now through our step-by-step guide here to begin your first investment.
Just getting started with stocks? Get the free stock basics ebook here and master the fundamentals of investing with ease.
Further reading: