Bearish Candlestick Patterns: What Every Trader Should Know
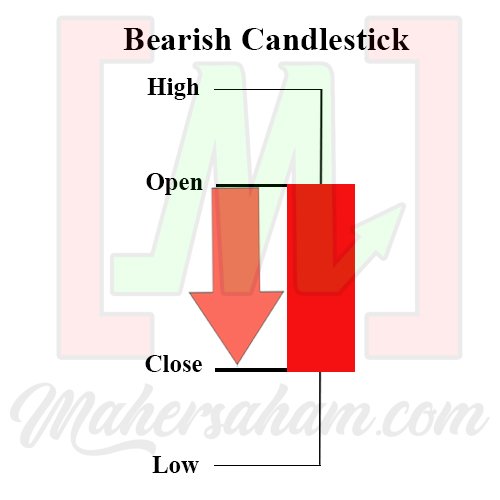
What Is a Bearish Candlestick?
The term bearish candlestick is derived from the animal ''bear''. If you have ever noticed, how does a bear attack?
A bear strikes from top to bottom. This is why bearish candlestick patterns are also known as indicators of price decline.
A red bearish candlestick means the share price has decreased, which occurs because there are more sellers than buyers.
Types of Bearish
- Bearish Continuation
- Bearish Reversal
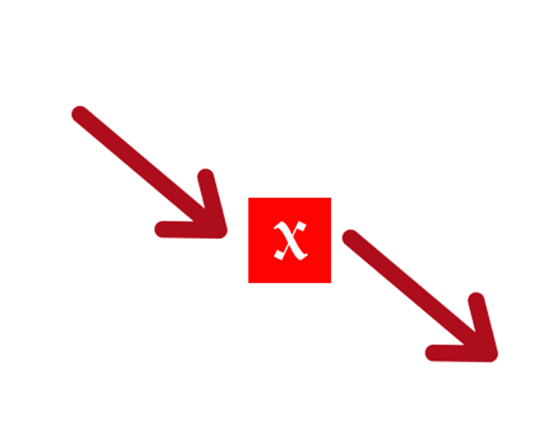
Bearish Continuation
When the market is in a downtrend and encounters a bearish candlestick, it will continue its downward movement.
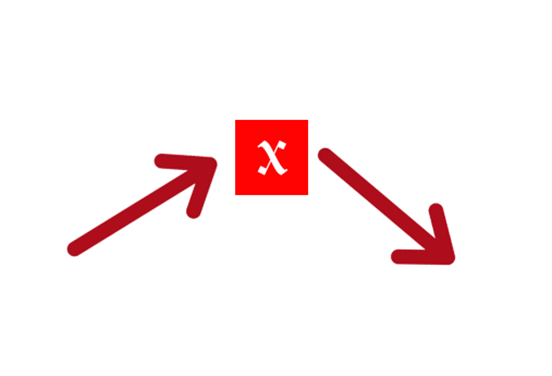
Bearish Reversal
When the market is in an uptrend and encounters a bearish candlestick, the market will reverse into a downtrend.
Types of Bearish Candlestick Patterns
- Bearish Engulfing
- Shooting Star
- Bearish Harami
- Evening Star
- Three Black Crows
Bearish Engulfing
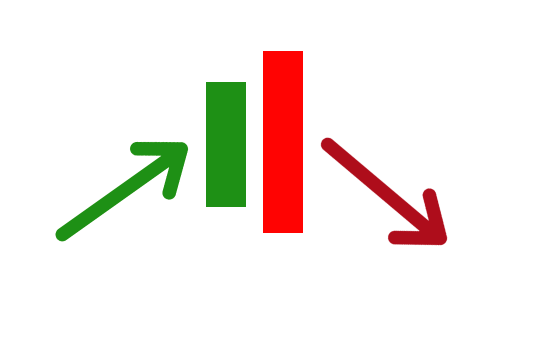
Initially, the market is in an uptrend. When a bearish engulfing pattern occurs, a reversal pattern will take place.
This means a downtrend will follow.
What are the criteria for a bearish engulfing pattern? The candle will ''engulf'' the candle next to it.
What does that mean?
Refer to the diagram above.
The condition described is when the red candlestick completely engulfs the entire green candlestick.
You can refer to the example on the trading chart below.
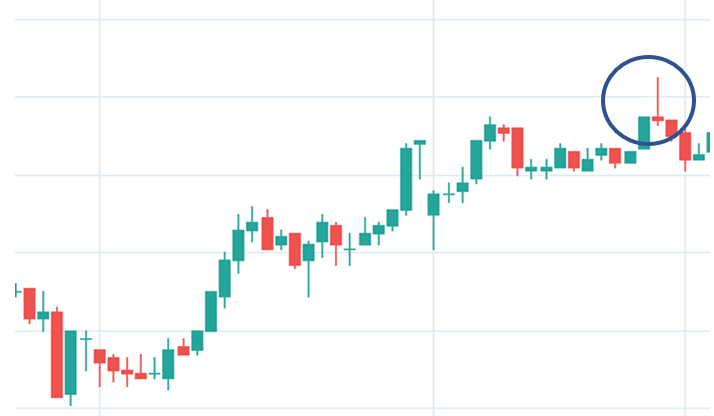
Shooting Star
This is a strong bearish signal.
The smaller the candlestick body, the stronger the bearish signal.
The longer the candlestick wick, the stronger the bearish signal.
When the market is in an uptrend and encounters a shooting star, it will then confirm a downtrend.
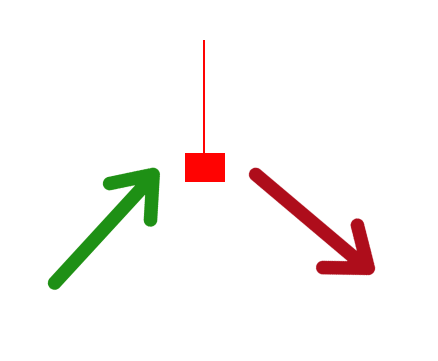
What are the signs of a shooting star?
The candlestick body is small but the wick is long.
The candlestick is at the peak. It does not matter whether it is red or green.
Do you understand?
Refer to the chart below.
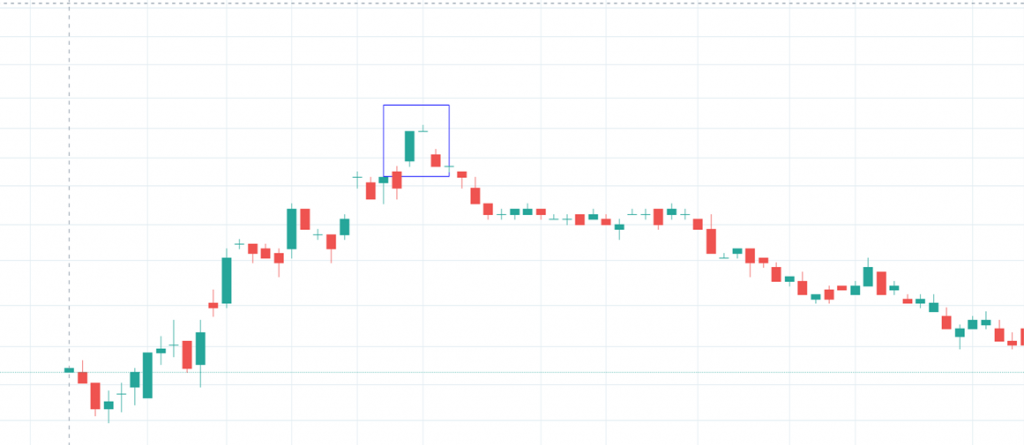
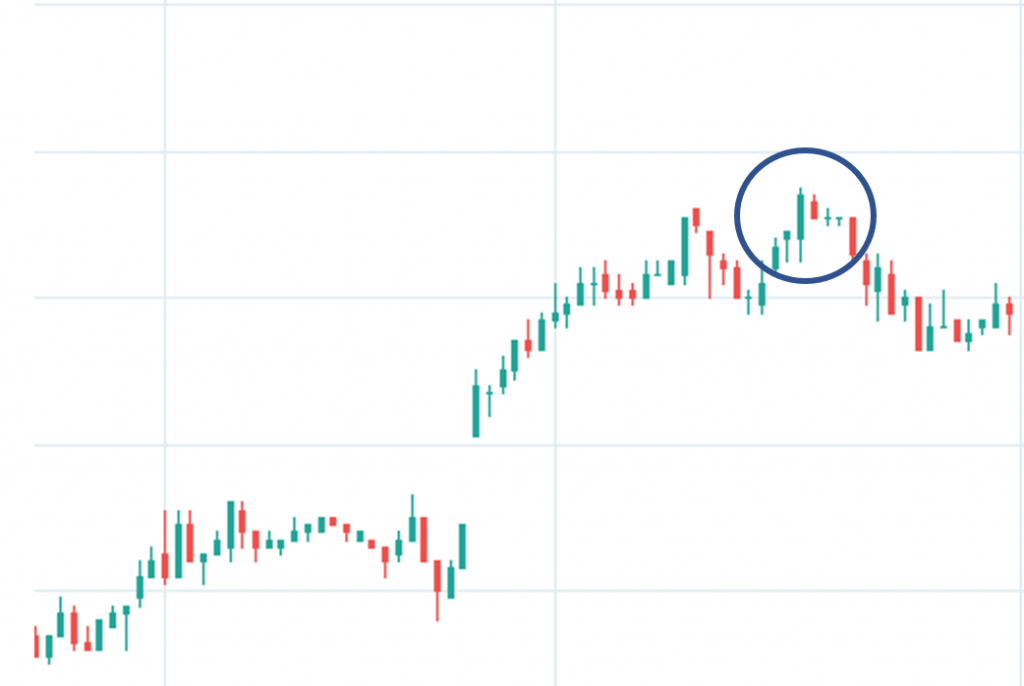
Evening Star
Focus on the 3 candlesticks inside the red box in the diagram below.
When the market is in an uptrend, the first candlestick is green.
Then there is a gap up with a small candlestick (regardless of whether it is red or green) at the top.
Next, the third candlestick is red.
Do you understand?
Refer to the chart below.
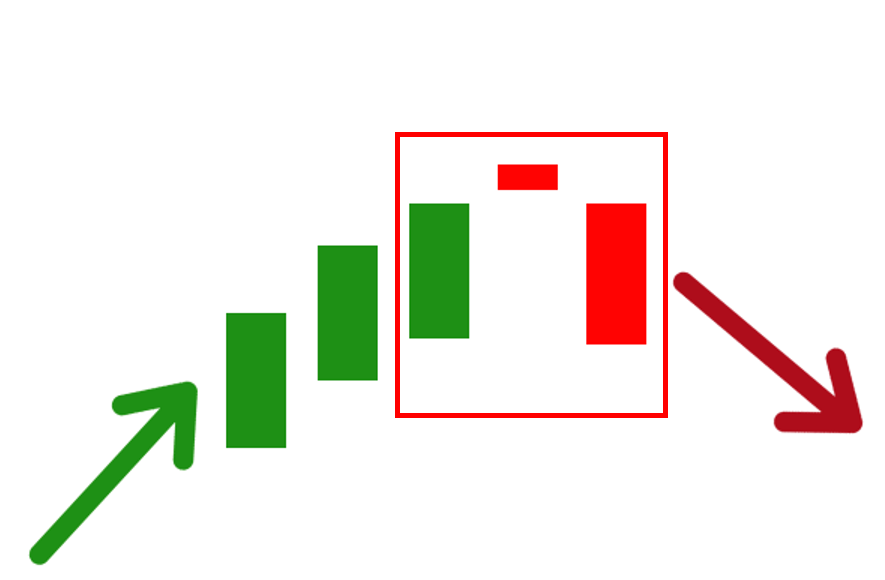
When you encounter these three conditions, that is an evening star pattern.
Three Black Crows
The history behind the name Three Black Crows comes from the imagery of seeing three crows falling one by one.
What is the connection to this type of candlestick?
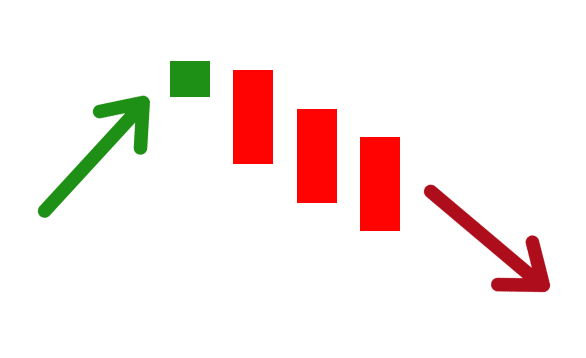
The three black crows pattern occurs when the market is in an uptrend, and the following day a first red candlestick appears.
On the second day, another red candlestick forms, even though the open price was higher than the previous day''s close (the price falls within the body of the first red candlestick).
On the third day, the third candlestick behaves similarly to the second — the open price is higher than the previous day''s close (the price falls within the body of the second red candlestick). However, the close price is lower than all previous days.
And the downtrend continues.
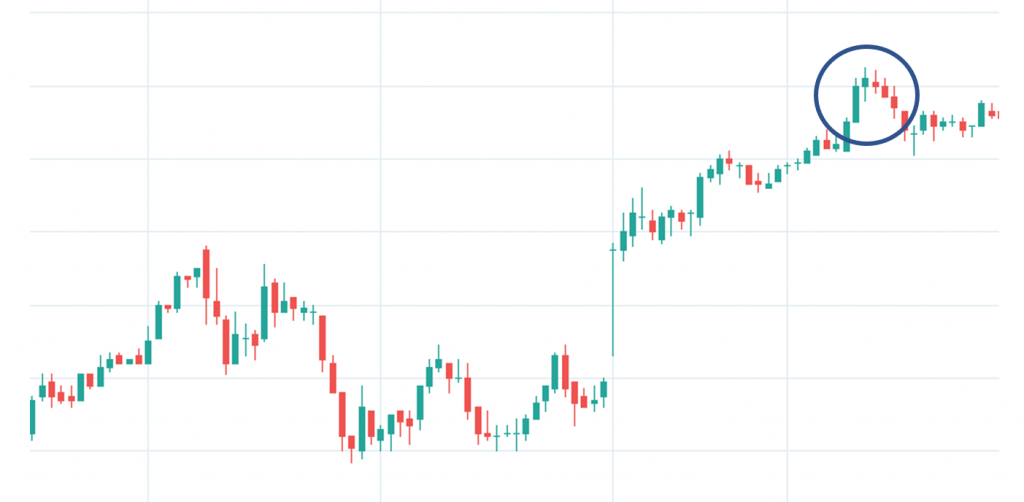
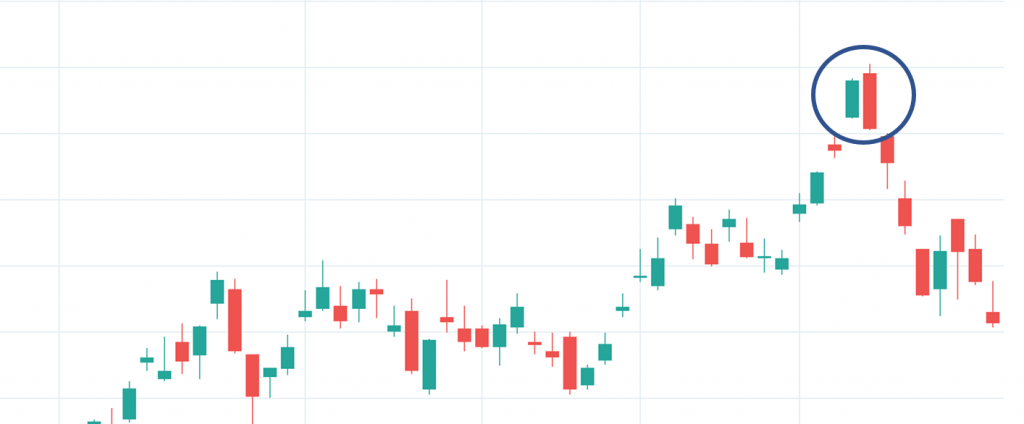
Bearish Harami
In Japanese, harami means pregnant.
If you look at the shape of the harami candlestick, it does resemble the shape of a pregnant belly.
The second candlestick is small — just like a belly.
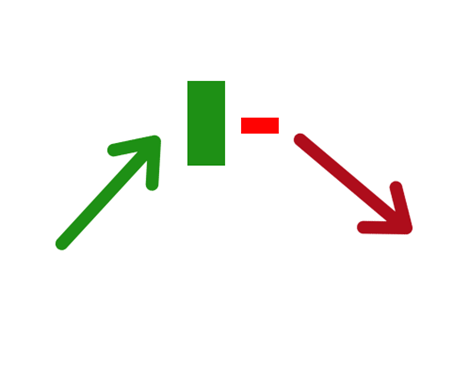
So how does the harami pattern form?
Initially, the market is in an uptrend, and the next day a small red candlestick appears.
The body size of the second candlestick falls within the body of the first candlestick.
The open price and close price of the second candlestick are within the range of the first candlestick''s body.
Refer to the diagram above.
After that, a downtrend begins.
We hope you now have a solid understanding of bearish candlestick patterns.
This knowledge will make it easier for you to create a trading plan.
Remember, there are many more types of bearish candlestick patterns out there.
Today, we covered 5 types of bearish candlestick patterns.
We hope this has been beneficial!
New to Stock Investing?
Want to learn about stocks? Want to know more?
But not sure where to start?
No worries — download the free Ebook from Mahersaham now!
And click here to open a CDS account with Mahersaham.
FAQ — Bearish Candlestick Patterns
What is a bearish candlestick?
A bearish candlestick is a red-coloured candlestick on a stock chart that indicates the share price has declined. It occurs when there are more sellers than buyers in the market, pushing the price downward.
What is the difference between bearish continuation and bearish reversal?
A bearish continuation occurs when the market is already in a downtrend and the bearish candlestick signals that it will continue falling. A bearish reversal occurs when the market is in an uptrend and the bearish candlestick signals a change in direction to a downtrend.
What are the 5 common bearish candlestick patterns?
The 5 common bearish candlestick patterns are Bearish Engulfing, Shooting Star, Bearish Harami, Evening Star, and Three Black Crows. Each pattern has unique characteristics that signal a potential price decline.
How reliable are bearish candlestick patterns for trading?
Bearish candlestick patterns are useful indicators but should not be relied upon in isolation. They are most reliable when confirmed by other technical analysis tools such as volume, support and resistance levels, and moving averages.
How do I identify a shooting star candlestick?
A shooting star has a small body with a long upper wick (shadow) and little to no lower wick. It appears at the top of an uptrend, and the colour of the body (red or green) does not matter. The longer the upper wick, the stronger the bearish signal.