Candlestick Anatomy and How to Read Stock Price Movement
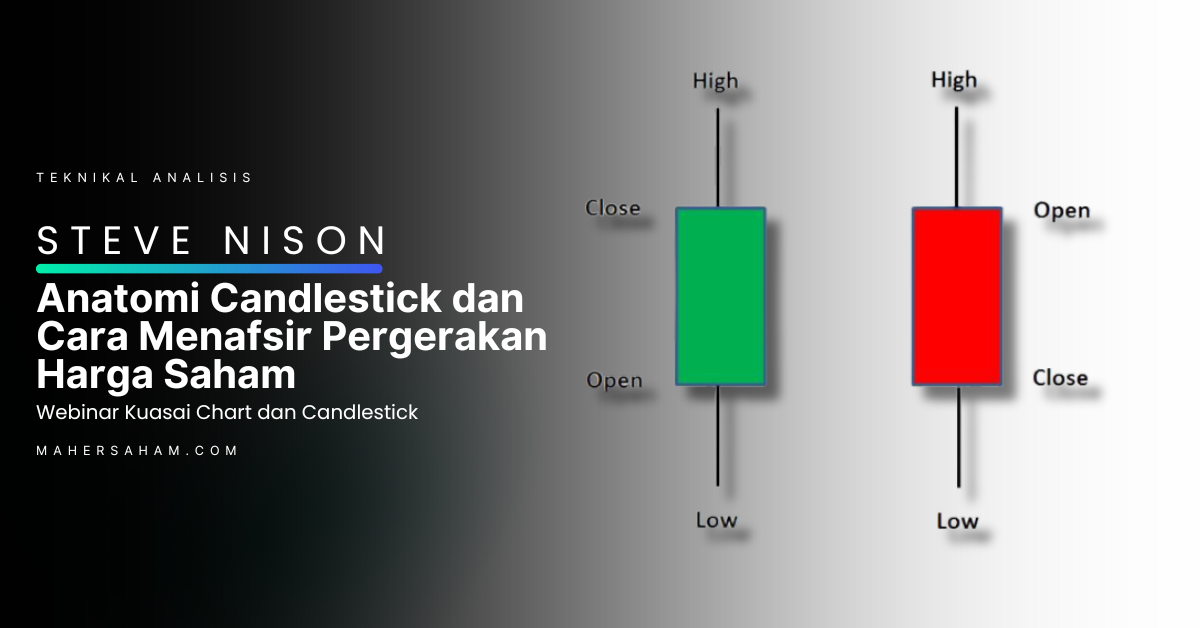
Candlestick is one of the most important elements in stock technical analysis. It provides a clear visual representation of price movement within a specific time period. The image above shows two basic types of candlestick – one in green (bullish) and another in red (bearish).
1. Basic Components of a Candlestick
Each candlestick consists of four key pieces of information:
Open – The price at which the stock opens at the beginning of the session.
Close – The price at which the stock closes at the end of the session.
High – The highest price reached throughout the session.
Low – The lowest price reached throughout the session. The body of the candlestick shows the difference between the opening and closing prices, whilst the wick/shadow above and below shows the highest and lowest price range.
2. Green Candlestick (Bullish)
Open is at the bottom, Close is at the top.
This means the stock price rose throughout the session.
It indicates strong buying pressure – buyers are dominating the market.
3. Red Candlestick (Bearish)
Open is at the top, Close is at the bottom.
This means the stock price fell throughout the session.
It indicates selling pressure – sellers are dominating the market.
4. How to Interpret Candlesticks
Long candlesticks (whether green or red) indicate strong momentum – either aggressive buying (bullish) or aggressive selling (bearish).
Short candlesticks indicate uncertainty or lack of momentum.
Long wicks at the top or bottom indicate price rejection at that level – a potential change in direction.
Conclusion
By understanding candlestick anatomy, investors can read price movements better and make more accurate decisions. It is like the visual language of the market – and with practice, it can become an extremely useful tool in your trading strategy.
![]() ZERO TECHNICAL KNOWLEDGE? DON''T KNOW WHEN TO BUY STOCKS?
ZERO TECHNICAL KNOWLEDGE? DON''T KNOW WHEN TO BUY STOCKS?
This Is Essential Knowledge You Must Have Before Entering the Market!
Many beginners jump into the stock market without technical knowledge — ending up trapped buying at peak prices and selling at a loss. ![]()
If you are still:
![]() Not sure when is the right time to buy stocks
Not sure when is the right time to buy stocks
![]() Confused looking at charts going up and down erratically
Confused looking at charts going up and down erratically
![]() Have bought based on ''tips'' only to lose your capital…
Have bought based on ''tips'' only to lose your capital…
![]() You MUST join the Candlestick & Chart Pattern Webinar by Mahersaham
You MUST join the Candlestick & Chart Pattern Webinar by Mahersaham
![]() What Will You Learn in This Webinar?
What Will You Learn in This Webinar?
![]() Understand Candlesticks One by One – the secret language of price movement used by professional traders
Understand Candlesticks One by One – the secret language of price movement used by professional traders
![]() Recognise Powerful Chart Patterns – how to spot buying & selling opportunities early
Recognise Powerful Chart Patterns – how to spot buying & selling opportunities early
![]() When to Enter, When to Wait – timing knowledge that most beginners lack
When to Enter, When to Wait – timing knowledge that most beginners lack
![]() Read Charts Without Stress – no need to memorise hundreds of patterns, just the effective ones
Read Charts Without Stress – no need to memorise hundreds of patterns, just the effective ones
![]() Who Should Join?
Who Should Join?
![]() Complete beginners with no technical knowledge
Complete beginners with no technical knowledge
![]() Those who have lost money buying without knowledge
Those who have lost money buying without knowledge
![]() Those who want to start trading stocks with full confidence
Those who want to start trading stocks with full confidence
![]() SPECIAL BONUS:
SPECIAL BONUS:
![]() Premium Candlestick Notes for participants
Premium Candlestick Notes for participants
![]() Webinar Recording (for early registrants)
Webinar Recording (for early registrants)
![]() Temporary Support Group for follow-up questions
Temporary Support Group for follow-up questions
![]() Limited Spots – Registration Now Open
Limited Spots – Registration Now Open
![]() Online: Join from anywhere
Online: Join from anywhere
![]() Register Now:
Register Now:
Frequently Asked Questions (FAQ)
What are the main components in candlestick anatomy?
A candlestick consists of four main components: the opening price (open), closing price (close), highest price (high), and lowest price (low). The candlestick body shows the range between the opening and closing prices, whilst the upper and lower wicks show the highest and lowest prices during that period.
What is the difference between bullish and bearish candlesticks?
A bullish candlestick is typically green or white, indicating the closing price is higher than the opening price. A bearish candlestick is red or black, indicating the closing price is lower than the opening price. These colours help traders quickly identify the direction of price movement.
How do you use candlesticks to predict stock price movement?
You need to observe candlestick patterns such as doji, hammer, engulfing, and morning star. These patterns signal whether a trend will continue or reverse. Combine candlestick reading with other technical indicators such as volume and moving average for stronger signals.
Is candlestick analysis suitable for beginner investors?
Yes, candlestick analysis is highly suitable for beginners as it provides an easy-to-understand visual representation of price movement. Start by learning basic patterns before moving on to more complex ones. With consistent practice, you will become more proficient at reading candlestick charts.
Mastering candlestick anatomy is the first step to becoming a more skilled trader. With this knowledge, you can begin analysing stock charts and making more accurate investment decisions.
Open your CDS account today through our step-by-step guide here to start investing in the stock market.
Download the free stock basics ebook to learn the fundamentals of stock investing from scratch.