Candlestick Basics: How They Are Formed
The Origin of Candlestick Analysis
Between 1724 and 1803, candlestick analysis was used by Munehisa Homma, a rice trader in Japan.
He used candlestick analysis to understand the price fluctuations of rice at that time.
According to history, the distance between Munehisa Homma and the rice supply location was quite far.
To obtain accurate analysis, he needed market price data delivered quickly.
As we know, during that era, there were no telephones or internet to get real-time data.
Can you guess how he managed to get data quickly back then?
What Munehisa Homma did was station a representative at the rice supply location and several more representatives at fixed intervals all the way to his home.
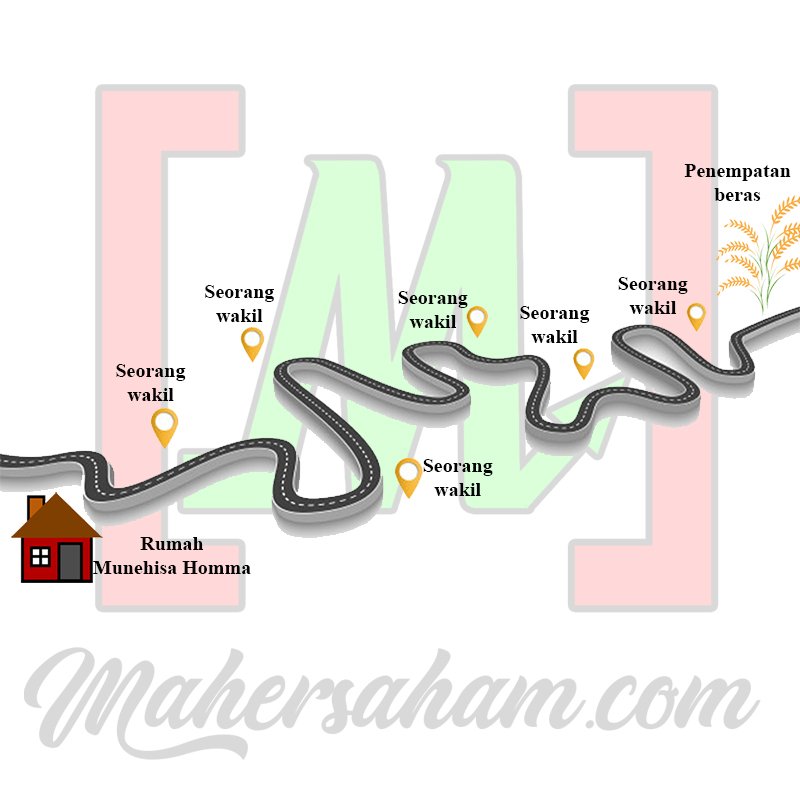
Through this method, he was able to obtain information about the current rice prices at that time.
From that data, he recorded and used candlestick analysis to become a successful rice trader in Japan.
How Is a Candlestick Formed?
There are 4 terms you need to remember.
- Open
- High
- Low
- Close
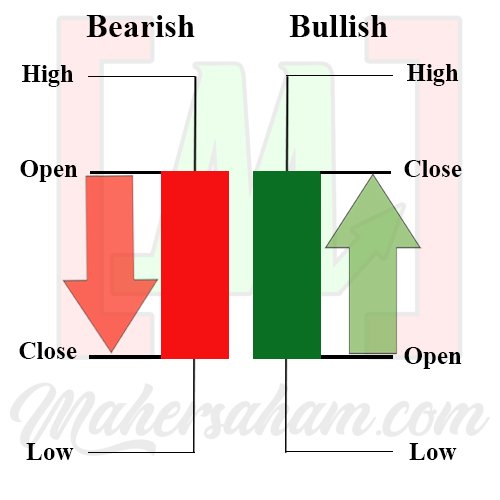
A candlestick is formed from Open, High, Low, and Close.

Open: The opening price of a stock when trading begins.
High: The highest price of a stock within a specific time period (depending on the time frame).
Low: The lowest price of a stock within a specific time period (depending on the time frame).
Close: The closing price of a stock when trading ends.
A red (black) candlestick means the open price is higher than the close price, indicating a price decline.
Meanwhile, a green (white) candlestick means the open price is lower than the close price, indicating a price increase.
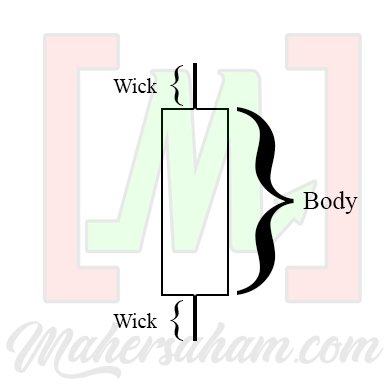
A candlestick does not necessarily have a wick; it may only consist of a body.
Why?
Because the open/close price is the same as the high/low price.
A candlestick may also have no body at all.
Why?
Because the close and open prices are the same, so no body is formed.
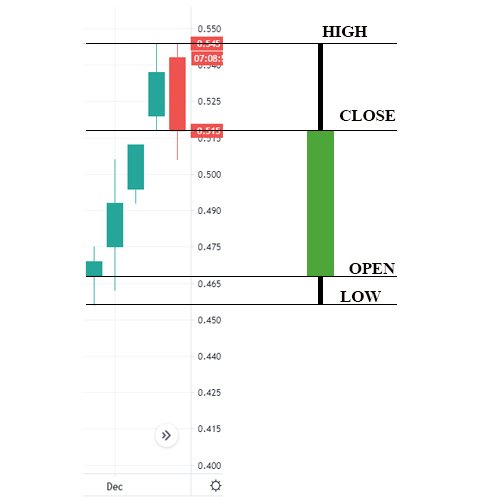
Candlestick Formation (Daily Time Frame)
As we know, the market opens at 9 AM and closes at 5 PM.
Throughout that period, the stock price will fluctuate or change.
Have a look at the diagram below. Stock prices are indeed inconsistent.
When the market opens, the price is at one level, then by 10 AM the stock price drops, and by around 4 PM before the market closes, the stock price rises again.
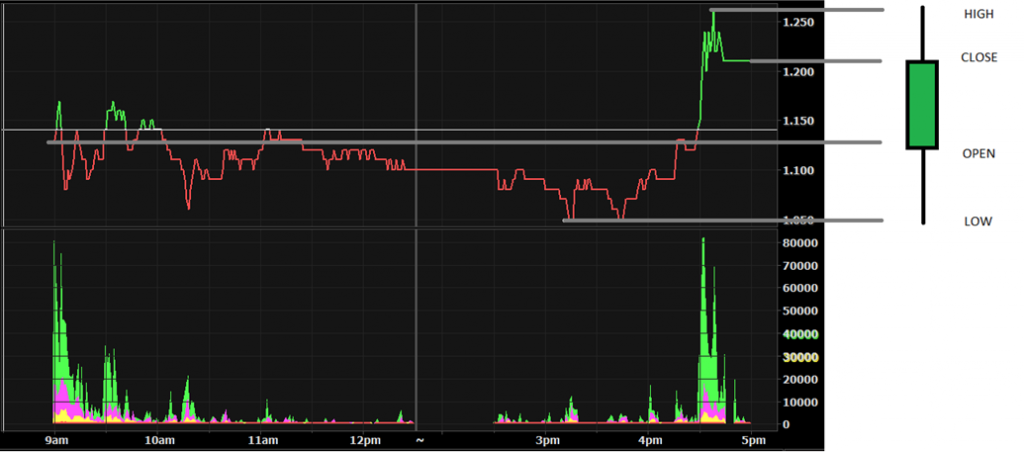
From these stock price movements, a single daily candlestick is formed.
Candlestick Formation (Weekly Time Frame)
Each candlestick in the diagram above represents a daily time frame, so 5 candlesticks represent a weekly time frame.
Why is a week only 5 days?
Because the market only opens on weekdays, from Monday to Friday.
So how is a weekly candlestick formed?
Refer to the diagram above.
The open is taken from the first candlestick (Monday), while the close is taken from the last candlestick (Friday).
The low and high are determined by looking at all candlesticks and selecting the lowest and highest values.
Once all the data is gathered, you can draw and form a weekly time frame candlestick.
Candlestick
• Serves as a leading indicator. A benchmark for supply (sellers) and demand (buyers).
• Determined by the size of the body and wick.
• A large green body is more bullish than a small green body. The same applies in reverse.
• A long tail indicates the strength of buyers or sellers, depending on the position of the tail.
We hope this has been beneficial!
Frequently Asked Questions (FAQ)
What is a candlestick in stock analysis?
A candlestick is a technical analysis method that displays stock price movements in chart form. Each candlestick shows four key pieces of information: the opening price (open), closing price (close), highest price (high), and lowest price (low) within a specific time period.
Who invented candlestick analysis?
Candlestick analysis was invented by Munehisa Homma, a rice trader from Japan who lived between 1724 and 1803. He used this method to analyse rice price fluctuations, and it was later adapted for modern stock markets.
What is the difference between a green and red candlestick?
A green (bullish) candlestick indicates the closing price is higher than the opening price, meaning buyers are dominating the market. A red (bearish) candlestick indicates the closing price is lower than the opening price, meaning sellers are dominating the market. The size of the body and tail determines the strength of the price movement.
How is a weekly time frame candlestick formed?
A weekly time frame candlestick is formed from the combination of five daily candlesticks (Monday to Friday). The open price is taken from Monday''s candlestick, the close price from Friday''s candlestick, while the high and low are taken from the highest and lowest values across all five days.
Want to learn technical analysis in greater depth? Open a CDS account with Mahersaham and start trading with proper knowledge.
Just starting to learn about stocks? Download the free Asas Saham ebook from Mahersaham now!
Further reading: