Beyond Candlesticks: Renko, Heikin-Ashi & Point-and-Figure Charts Explained
Open TradingView or any trading platform today and the first chart you see is almost certainly a candlestick. Candlesticks are popular, easy to read, and used in nearly every stock trading tutorial. But many traders never realise that candlesticks are not the only way to visualise price movement.
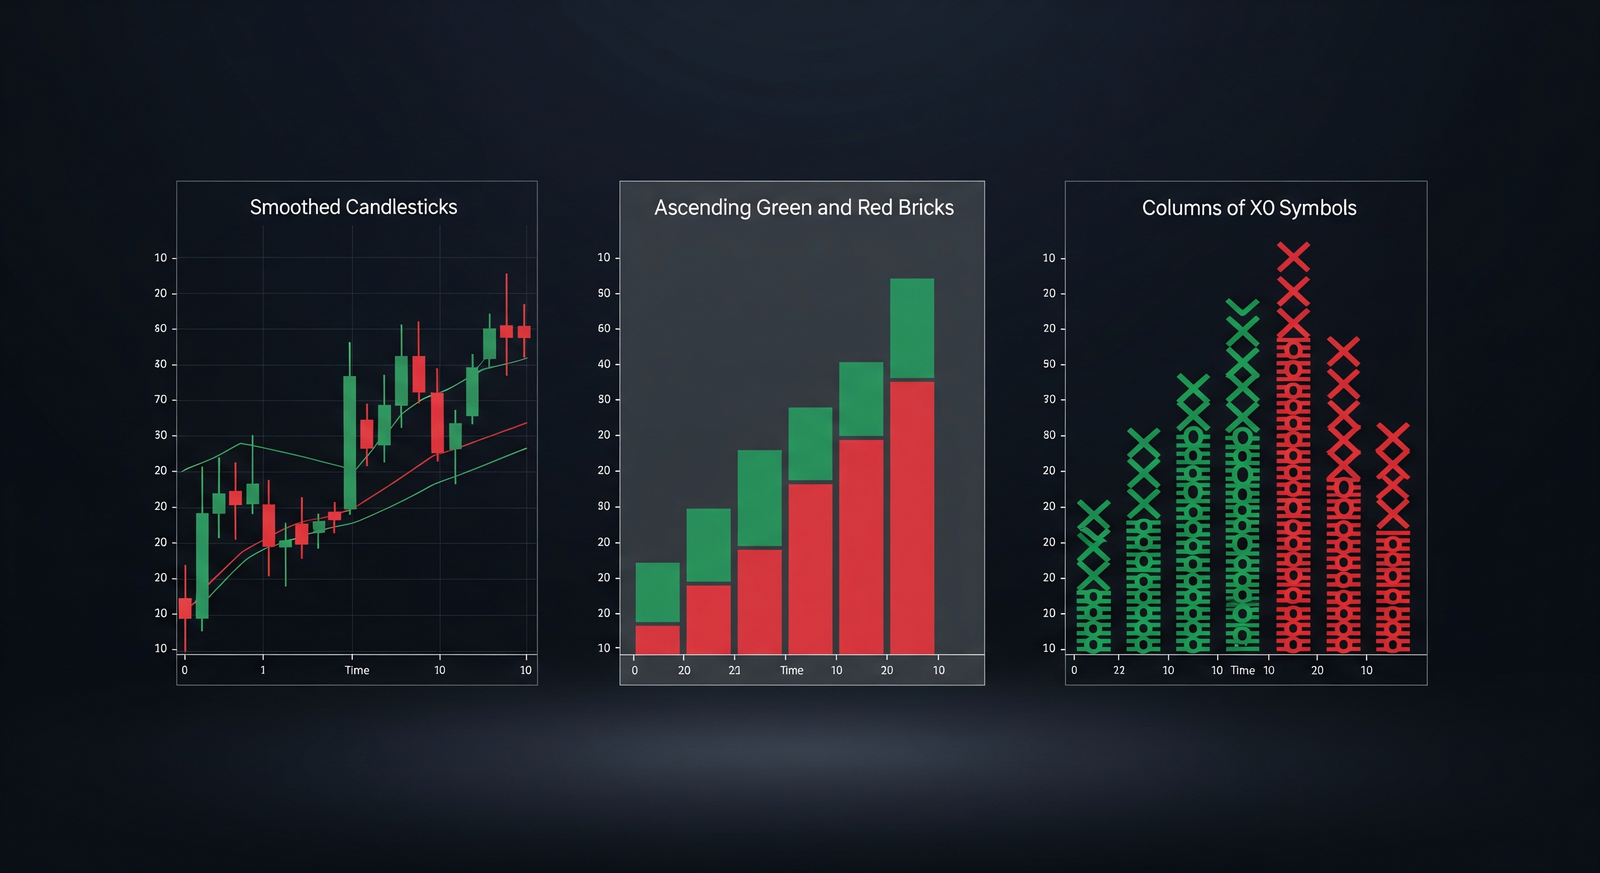
There are three alternative chart types designed to solve one big problem: "noise", the visual clutter that makes you misread a trend. These charts are Heikin-Ashi, Renko, and Point-and-Figure. All three filter out unimportant price movement so you can focus on the market's real direction.
This article explains each one in plain language: what it is, how it works, when to use it, and its weaknesses. By the end, you will know which chart best fits your trading style.
Why Candlesticks Sometimes Fall Short
Candlesticks give you complete information for every time period - open, close, high, and low. That is great for detailed analysis. The problem is that in a sideways or choppy market, candlesticks can look like a "forest" of red and green candles that flip colour almost every bar.
For a trader trying to identify a trend, this clutter is the enemy. You might see one big red candle and panic sell, when the overall trend is actually still rising. This phenomenon is called "market noise", and it is a leading reason why many traders exit profitable positions too early.
This is where alternative charts come in. Heikin-Ashi, Renko, and Point-and-Figure are all built with the same goal - reduce noise and highlight the trend. How they do it differs, and that is what we will break down one by one. If you are new to basic chart concepts, it helps to read our 22 essential technical analysis terms first.
Heikin-Ashi: The Smoothed Candlestick
The term "Heikin-Ashi" comes from Japanese - Heikin means "average" and Ashi means "pace" or "bar". So literally, Heikin-Ashi means the "average pace" of price. This chart looks almost identical to a normal candlestick, but with one big difference: each candle is calculated using an averaging formula, not the actual price.
How It Works
A normal candlestick uses the real open, high, low, and close for each period. Heikin-Ashi modifies these values using a formula that takes into account both the current and the previous candle. For example, the Heikin-Ashi "close" is the average of the open, high, low, and close for that period. The "open" is the average of the previous candle's open and close.
The effect of this formula is a smoother chart. During a strong uptrend, you will see a series of consecutive green candles with little interruption. When the trend starts to turn, candles begin to show "shadows" and change colour. This makes Heikin-Ashi very useful for trend followers.
Unlike Renko and Point-and-Figure, Heikin-Ashi is still tied to time. A new candle still forms every period (e.g. every hour or every day), regardless of how much price moves. According to Investopedia, the technique shares the same Japanese charting tradition as the candlestick itself.
Heikin-Ashi: Pros & Cons
Pros: Excellent for identifying and holding onto a trend. It reduces the temptation to exit early because small fluctuations are masked. Ideal for swing traders and position traders.
Cons: Because the displayed price is an average, it is NOT the real market price. You cannot use Heikin-Ashi to know the exact entry or exit price - you need a normal candlestick for that. It is also slower to signal reversals (lagging) than a real candlestick.
Renko: The Chart That Removes Time
The name "Renko" comes from the Japanese word renga, which means "brick". When you look at a Renko chart, you will understand why - it looks like a neat stack of bricks climbing up or down. This is the most drastic chart when it comes to removing noise, because it ignores time entirely.
How It Works
In Renko, you set a "brick size" - for example 10 sen for a Bursa stock, or 10 points for an index. A new brick only forms when price moves by that brick size from the close of the previous brick. If price rises 10 sen, a green brick forms. If price falls 10 sen, a red brick forms.
Interestingly, bricks never form side by side. Each brick forms at a 45-degree angle up or down. To change direction - say from up to down - price must move by TWICE the brick size. This rule filters small movements very effectively.
Because time is ignored, a single Renko brick might take a few minutes to form during a fast market, or several days (even weeks) during a quiet one. A Renko chart does not care how long - it only cares about price movement. This makes the trend very clear: a series of green bricks means an uptrend, a series of red bricks means a downtrend. According to Investopedia, Renko is especially popular among traders who want a mechanical, emotion-free strategy.
Renko: Pros & Cons
Pros: Trends look very clean and clear. It is great for identifying support and resistance levels as well as breakouts. Many traders use Renko to place more logical stop losses because noise has been filtered out.
Cons: Because time is ignored, you lose information about how long a move took. Renko can also be "slow" - because a brick only forms after a full move, you might enter or exit a little late. Brick size selection is also critical: too small and noise returns; too large and signals become too slow.
Point-and-Figure: The Century-Old X and O
Point-and-Figure (P&F) may be the most foreign chart to modern traders, but it is actually one of the oldest charting methods - used since the late 1800s, long before computers existed. Like Renko, P&F also ignores time and focuses only on significant price movement.
How It Works
Point-and-Figure uses columns of X and O symbols instead of candles or bars. An X column represents rising prices, while an O column represents falling prices. Each X or O represents a certain "box size" (for example 10 sen).
The key concept in P&F is the "reversal amount" - usually set to 3 boxes. This means price must move in the opposite direction by 3 boxes before a new column (switching from X to O or vice versa) is printed. This rule automatically filters small moves and records only movements that truly matter.
According to StockCharts, one strength of P&F is its ability to identify support and resistance levels very clearly because the chart only shows "important" prices. P&F also has its own formations such as the "double top breakout" and "triple bottom" that serve as classic trading signals.
Point-and-Figure: Pros & Cons
Pros: Very clean and objective. It removes almost all noise and forces you to focus on important price levels. Breakout formations are easy to spot. Good for medium to long-term traders.
Cons: It does not clearly show volume or time. For many modern traders used to candlesticks, P&F takes time to get used to. It is also less useful for day trading, which requires precise timing information.
Quick Comparison: Three Charts, Three Approaches
Here is a summary of the key differences between these three alternative charts:
| Feature | Heikin-Ashi | Renko | Point-and-Figure |
|---|---|---|---|
| Considers time? | Yes (time-based) | No | No |
| Visual form | Candles (like candlestick) | 45° bricks | Columns of X and O |
| Noise filtering | Moderate (averaging) | Strong (brick size) | Strong (box + reversal) |
| Shows real price? | No (averaged) | No (blocks) | No (boxes) |
| Best for | Trend following | Trend & breakout | Support/resistance |
| Main weakness | Lagging, not real price | Loses time info | No clear volume/time |
The most important thing to understand: these three charts are NOT replacements for the candlestick, but complements. Many professional traders use Heikin-Ashi or Renko to confirm trend direction, then switch to a normal candlestick to find precise entry and exit points.
Which Chart Is Right for You?
Your chart choice depends on your trading style and goals:
- If you are a trend follower / swing trader: Heikin-Ashi is the best choice. It helps you "sit" in a trend longer without panicking over small fluctuations. Combine it with indicators like moving average or RSI for confirmation.
- If you focus on breakouts & clean trends: Renko is very suitable. The tidy stack of bricks makes it easy to see when a trend begins and ends. It is also great for traders who want a mechanical, disciplined strategy.
- If you are a medium to long-term investor: Point-and-Figure can help you identify important price levels and avoid getting "trapped" in meaningless daily moves.
Our advice: do not switch away from candlesticks entirely. Instead, add one alternative chart as a "second layer" of analysis. For example, look at Heikin-Ashi to confirm the trend, then open a candlestick for timing. This layered approach is more powerful than relying on a single chart type. You also cannot escape risk management basics like stop loss and position sizing - no chart can replace this discipline.
How to Use Alternative Charts on TradingView
Most modern platforms including TradingView support all three charts for free. On TradingView, click the chart type icon in the top bar (usually labelled "Candles"), and you will see a list of options including Heikin Ashi, Renko, Kagi, Line Break, and Point & Figure.
For Renko and P&F, you can adjust settings such as brick size or box size and reversal amount through the settings menu. Our suggestion: start with the default settings, then adjust slowly while observing the effect on a stock chart you regularly monitor. For low-priced Bursa Malaysia stocks (e.g. below RM1), a small brick size like 1-2 sen may be more suitable.
If you use another platform such as M+ Online or ShareInvestor, check whether they support these chart types. Most local broker platforms support at least Heikin-Ashi. If you are just starting out with trading, we recommend reading our beginner indicator guide first so you know how to combine charts with other indicators.
Common Mistakes When Using Alternative Charts
Many new traders make these mistakes when they first use alternative charts:
- Assuming the chart price is the real price. Remember - Heikin-Ashi, Renko, and P&F all display processed values, not the real market price. Do not place orders based on the price you see on Heikin-Ashi.
- Abandoning candlesticks entirely. Alternative charts are an additional tool, not a replacement. You still need candlesticks for precise timing.
- Not understanding the effect of brick/box size settings. The wrong brick or box size can make a chart misleading. Too small = noise returns; too large = signals too slow.
- Using them for day trading without understanding lag. Renko and P&F ignore time, so they are less suitable for scalping or fast day trading that requires timing precision. If day trading is your goal, read our reality of day trading for beginners first.
Frequently Asked Questions (FAQ)
1. Is a Heikin-Ashi chart better than a candlestick?
Not necessarily "better" - it serves a different purpose. Heikin-Ashi is better for holding a position within a trend, while candlesticks are better for precise entry and exit timing. Many traders use both together.
2. Which chart is most suitable for beginners?
Heikin-Ashi is the easiest for beginners because its shape resembles a candlestick but is easier to read. Renko and Point-and-Figure take a little time to get used to.
3. Can I use Renko for Bursa Malaysia stocks?
Yes. Renko works on any instrument with price data, including Bursa stocks. The key is to set a brick size that suits the stock's price range - cheap stocks need a small brick size.
4. Are these alternative charts free on TradingView?
Yes. Heikin-Ashi, Renko, and Point-and-Figure are available on TradingView's free plan. Some advanced features may require a paid plan, but these three basic charts can be used at no cost.
5. What is the difference between Renko and Point-and-Figure if both ignore time?
Renko uses bricks at a 45-degree angle and only needs one brick size of movement for a new brick (twice to change direction). Point-and-Figure uses columns of X and O with a reversal amount (usually 3 boxes) before a column changes. P&F places more emphasis on formations like double top/bottom.
6. Can I use indicators like RSI or MACD on alternative charts?
Yes, but be careful. Because these charts process price differently, indicator values will also differ from a normal candlestick. Test first and understand the difference before relying on the signals.
7. Which chart is best for detecting long-term trends?
Point-and-Figure and Renko are both good for long-term trends because they filter out meaningless daily movement. Heikin-Ashi is also useful for medium-term swing trading.
Conclusion
Candlesticks are a great chart, but they are not the only option. Heikin-Ashi smooths noise through averaging, Renko removes the time factor with a stack of bricks, and Point-and-Figure uses columns of X and O to highlight price movement that truly matters. All three are designed for the same goal - helping you see the trend more clearly without distraction.
The key to success is not finding the "best" chart, but understanding the strengths and weaknesses of each one, then combining it with proper risk management discipline. Try each one on a stock you regularly monitor, and see which suits your style.
If you are serious about deepening your technical analysis and investing with more confidence, the first step is to own an account to trade in the real market.
Open your CDS account to start investing in Bursa Malaysia as well as foreign stocks such as the US and Hong Kong markets - one account for every opportunity.
Before that, download our free stock market basics ebook to build a solid foundation before you start trading.