Chart Game: Train Your Eye to Read Stock Charts Using Real Bursa Data

Many new investors spend months reading technical analysis books, watching YouTube videos, and memorising indicator names like RSI, MACD and Moving Average. Yet when they face a real chart on screen, they still freeze - unsure whether the signal they are looking at points up or down. The problem is not a lack of knowledge. The problem is a lack of practice.
Technical analysis is a pattern-recognition skill, and like any skill, it only sharpens through repetition. This is where Chart Game by Mahersaham comes in. It is a free training game that lets you train your eye to read charts using real Bursa Malaysia data - not the polished textbook examples, but actual price charts that genuinely happened in the market.
What Is Chart Game by Mahersaham?
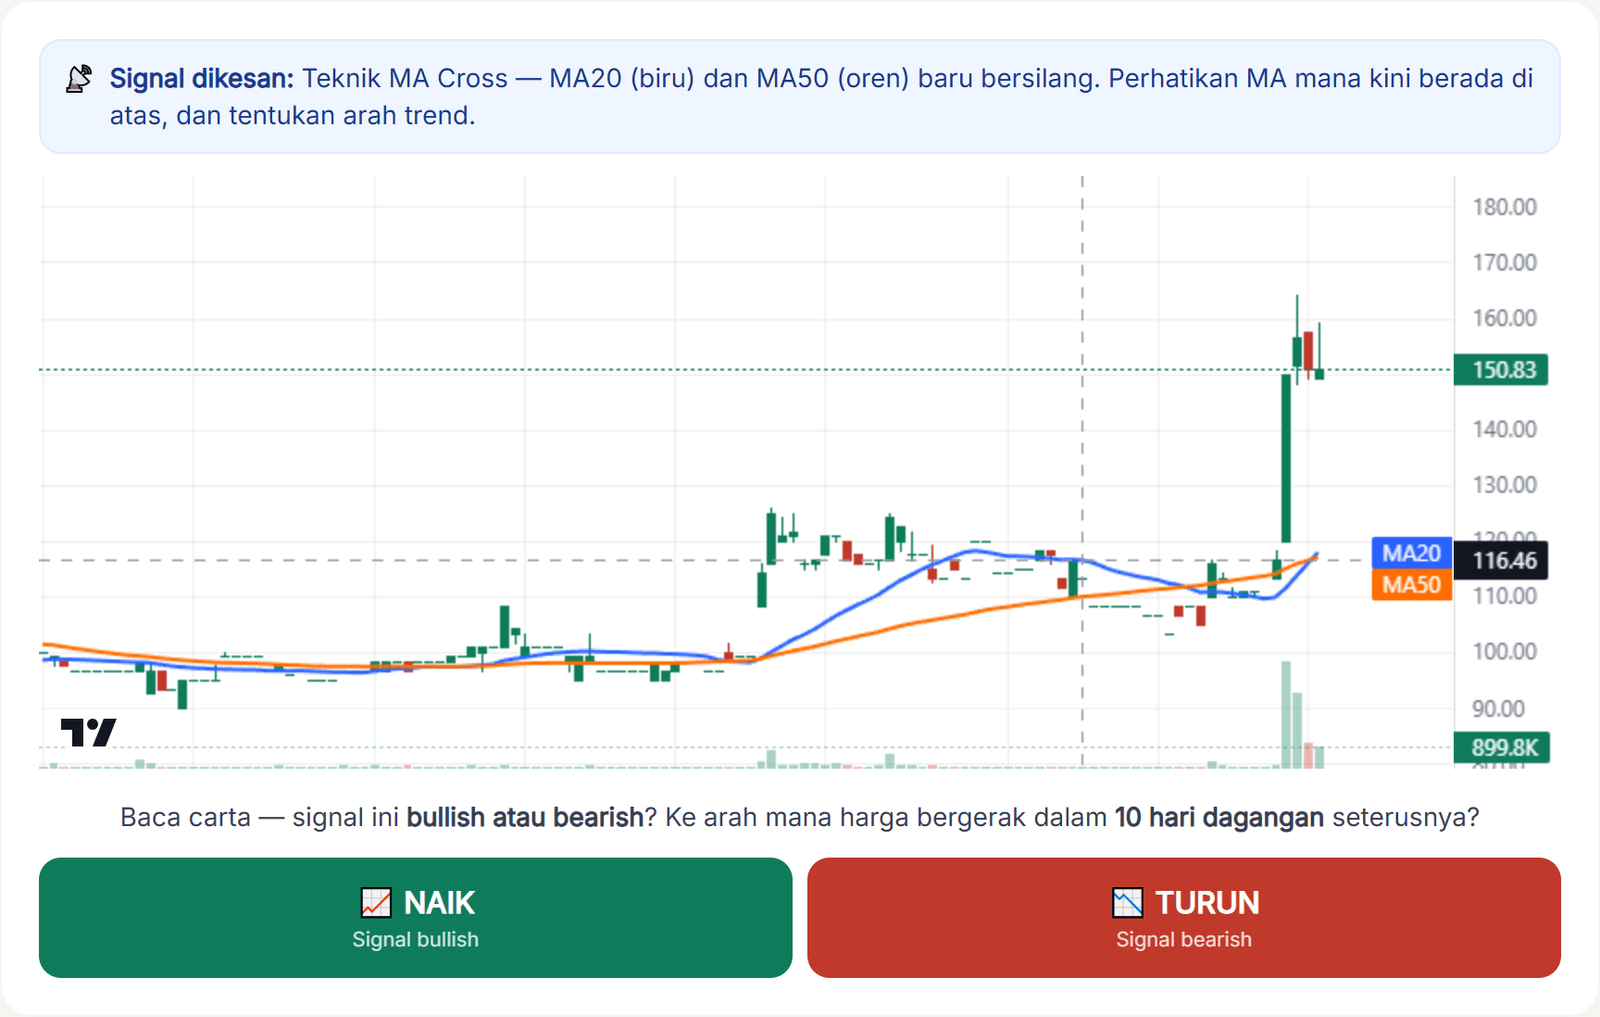
Chart Game is a technical analysis training platform at mahersaham.com/game that displays real Bursa Malaysia price charts and challenges you to read the technical signals on them. Each challenge shows 120 trading days of real data - with the stock name and dates hidden so you cannot "cheat" - and your task is to decide whether the detected signal is bullish (up) or bearish (down). Once you answer, the next 10 candlesticks play automatically, the real stock is revealed, and a full theoretical explanation is shown.
In short: you look at a chart, you make a decision, and you immediately see whether your call was right or wrong. This fast feedback loop is exactly what accelerates learning.
Why "Training Your Eye" Matters More Than Memorising Theory
There is a huge gap between knowing the definition of a golden cross and seeing a golden cross form in the middle of 120 days of chaotic price action. A book can teach you "when MA50 crosses above MA200, that's a bullish signal" - but a book cannot train your brain to recognise that pattern in real time, among dozens of other confusing price movements.
According to Investopedia, technical analysis is the discipline of evaluating investments and identifying trading opportunities based on price patterns and trends on charts. The key word here is identifying - a visual skill that can only be honed by looking at hundreds of examples. It is the same principle behind how chess masters or pilots train: not by reading more, but by repeating real situations over and over until the response becomes instinct.
Chart Game is built specifically for this kind of repeated practice. With 400 real charts across 10 different techniques, you can build your chart-reading "flight hours" in a matter of hours - something that might otherwise take years if you rely only on daily market observation.
How to Play: 3 Simple Steps
The way you play Chart Game is deliberately kept simple so you focus on learning, not on figuring out a complicated interface:
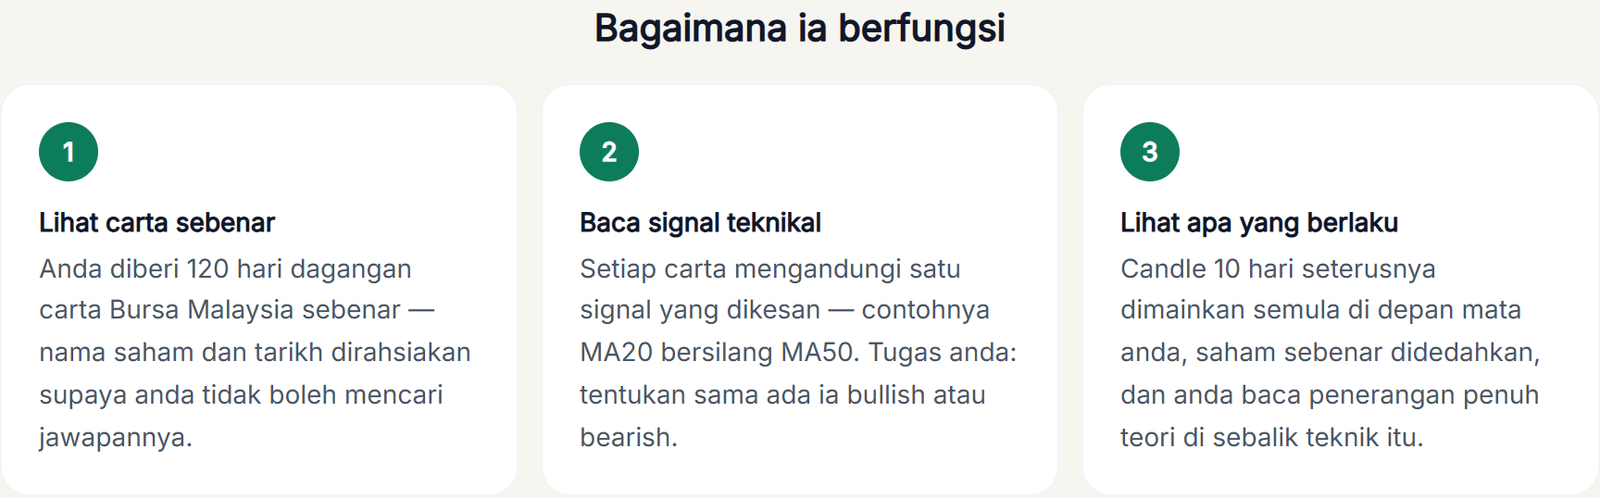
- View a real chart. You are shown 120 trading days of Bursa Malaysia data. The stock name and dates are hidden so you judge purely on the chart, not on your feelings about a particular counter.
- Read the technical signal. Each chart contains one detected signal - for example, a moving average crossover. You must decide whether that signal points to price going up or down.
- See the real outcome. The next 10 candlesticks play automatically, the actual stock is revealed, and you receive a detailed theoretical explanation of why the signal worked the way it did.
The answer is always binary - up or down - so there is no room for unproductive hesitation. You make the call, you get scored, and you learn.
The "No False Signals" Principle - Why It Matters
This is the part that sets Chart Game apart from simply browsing random charts. Every challenge in the game follows one core rule: no false signals. A chart is only published if price genuinely moved the way the technical setup predicts. In other words, every explanation always demonstrates the theory working.
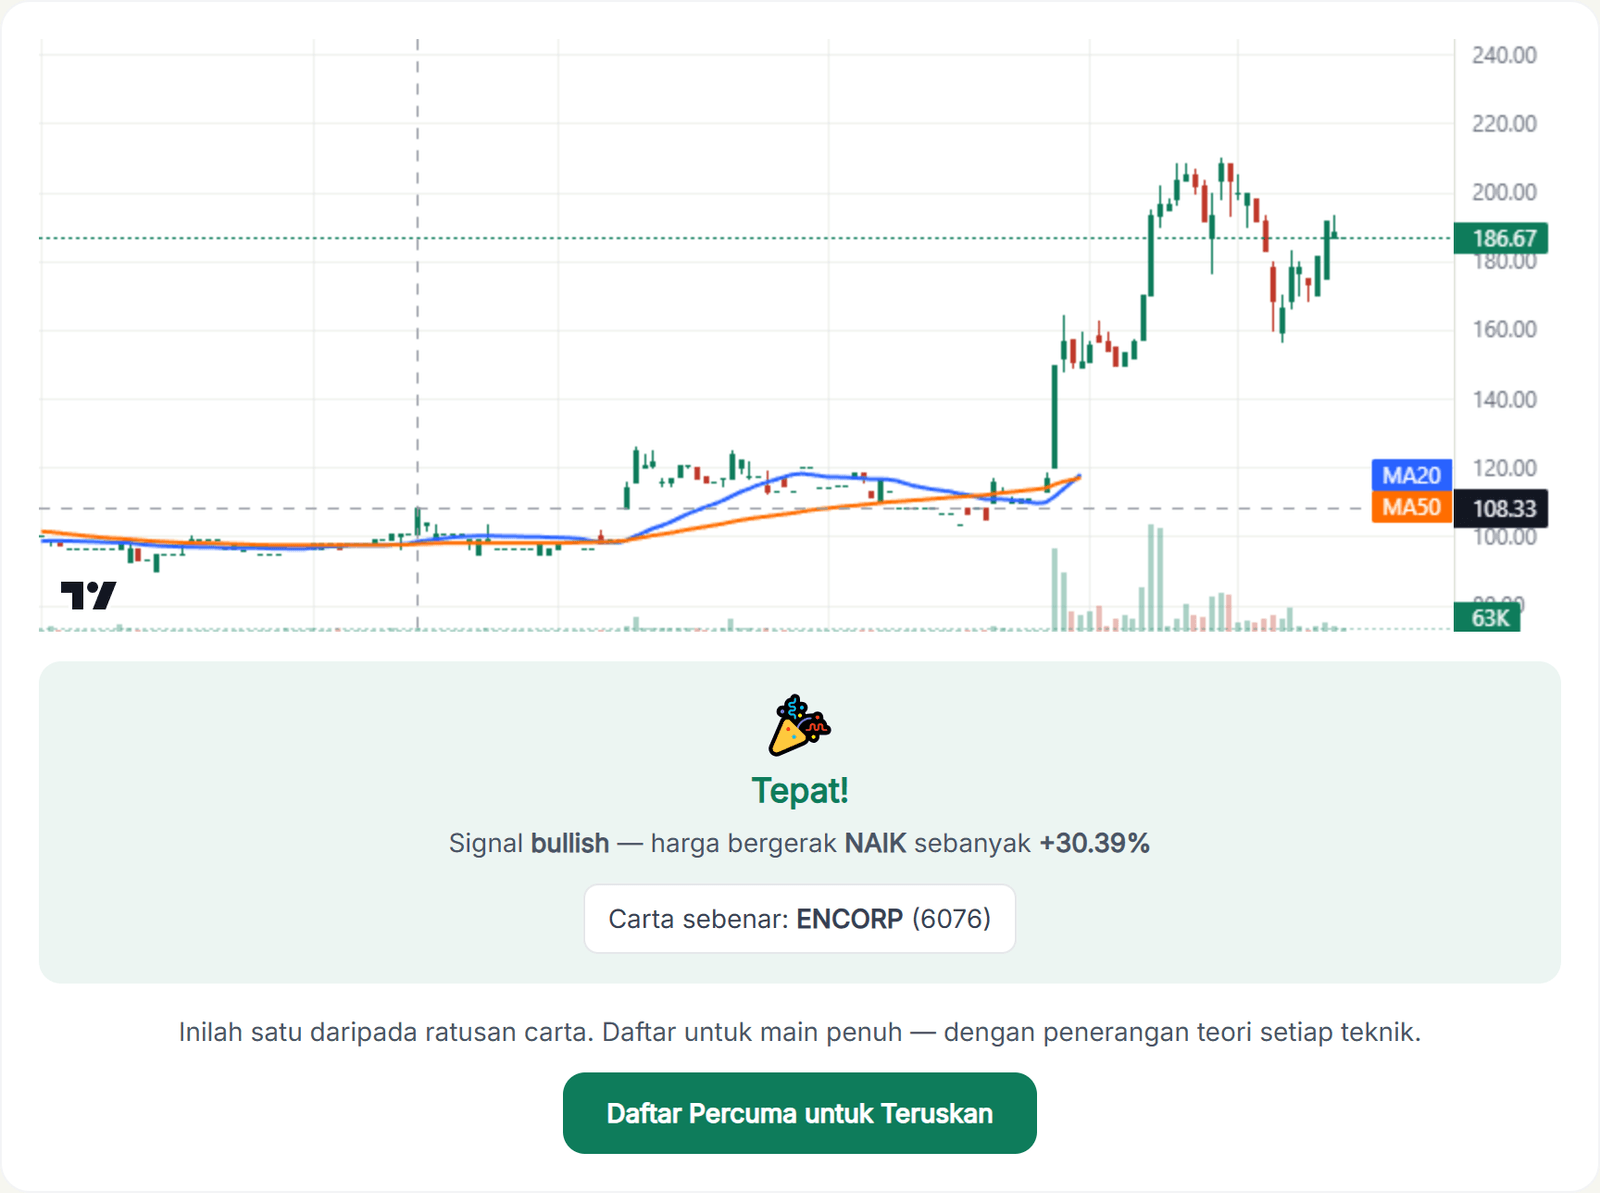
Why does this matter? Because many new investors learn the wrong patterns without realising it. They see one failed RSI oversold example, then conclude that "RSI is useless". Chart Game ensures you first learn how each technique is supposed to work under ideal conditions. Once you master the correct pattern, you are ready to handle false signals in the real market - but the foundation must be solid first.
To keep the answers un-guessable, each topic pairs a bullish and a bearish setup evenly. For example, the MA crossover topic has a golden cross (bullish) and a death cross (bearish); the RSI topic has a bounce off the 30 level (up) and a rejection off the 70 level (down). The hint only names the technique, not the direction - so you really have to read the chart, not guess.
10 Technical Analysis Techniques You Can Train
Chart Game covers 400 real charts across the 10 most important technical analysis methods. Each topic contains 40 charts - 20 bullish setups and 20 bearish setups - so you get balanced practice for every technique:
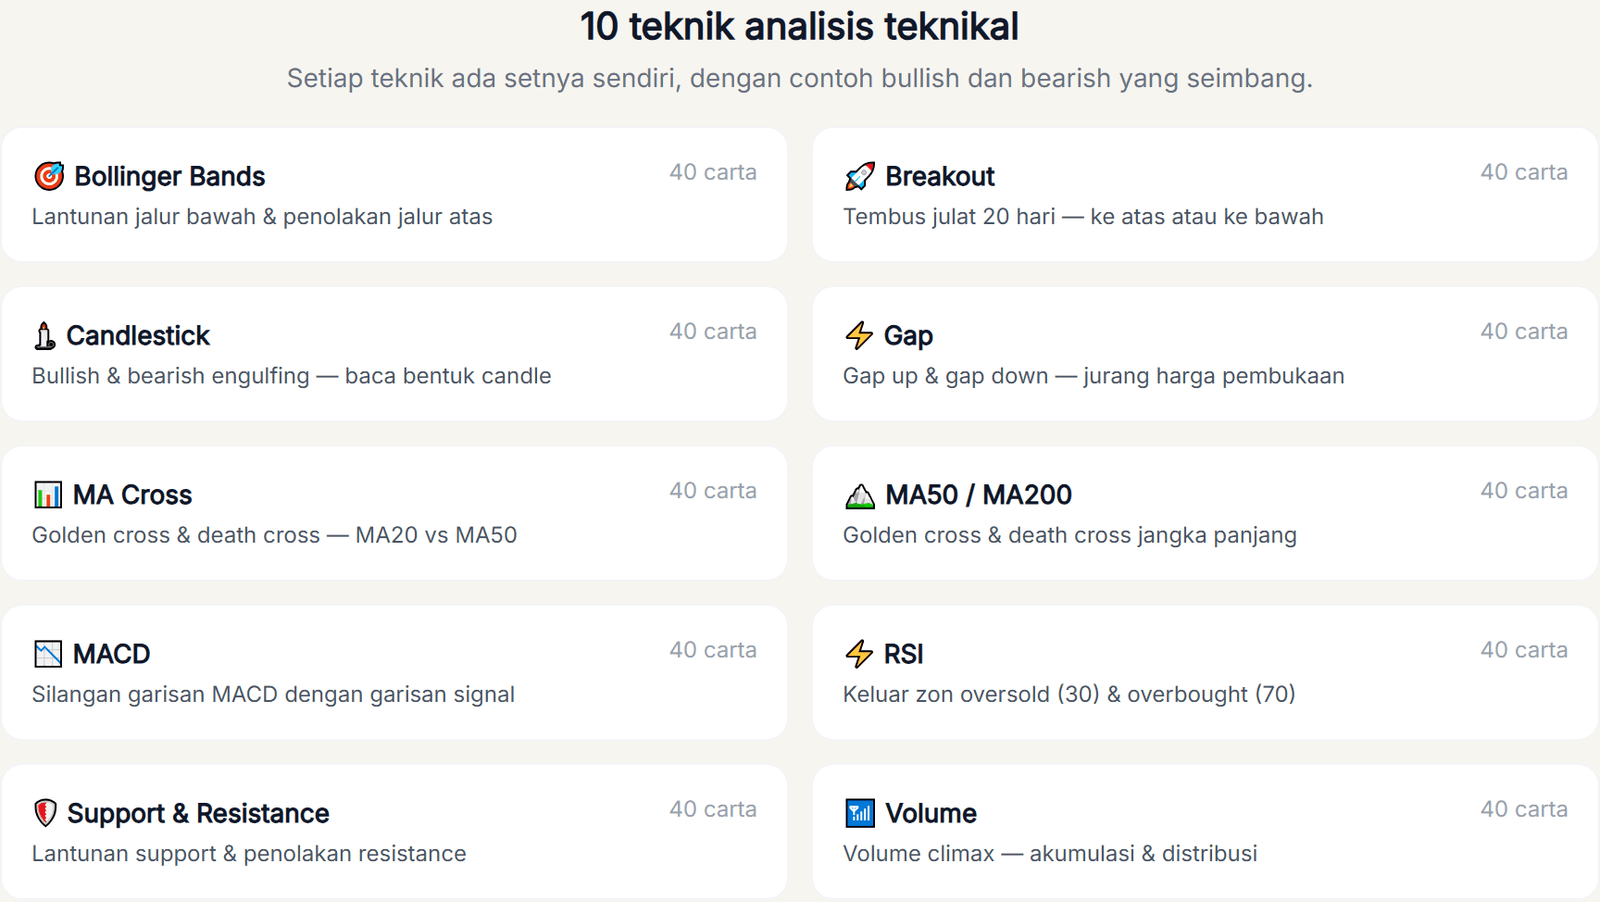
- MA Cross - when a short-term moving average crosses a long-term one, a classic momentum signal.
- MA50/MA200 - long-term crossovers that produce the golden cross and death cross often watched by institutional investors.
- RSI (Relative Strength Index) - detects overbought and oversold conditions to anticipate price reversals.
- MACD - crossover and divergence signals that indicate shifts in momentum.
- Bollinger Bands - bounces off the lower band and rejections off the upper band to gauge volatility.
- Breakout - when price breaks through a key resistance or support level.
- Support & Resistance - bounces off support levels and rejections off resistance levels.
- Candlestick - candle patterns such as doji, hammer, and engulfing that signal shifts in sentiment.
- Gap - price gaps that form between trading sessions and their implications.
- Volume - the relationship between trading volume and price movement to confirm a trend.
If these terms still feel unfamiliar, that's fine - you can start by reading our list of 22 must-know technical analysis terms before stepping into the practice arena.
4 Game Modes for Every Level
Chart Game offers four different ways to practise, depending on your goal and skill level:
- Daily Challenge - one new challenge every day, free for all registered users. This drives a daily streak and a consistent learning habit. A little practice every day is more effective than one marathon session once a month.
- Random Practice - random charts across all techniques. Ideal for testing how well you can identify signals without knowing in advance which technique will appear.
- Expert Mode - the hint is withheld entirely. You have to identify what signal exists on the chart yourself, then decide its direction. This is the real test for investors who are already comfortable.
- Practice by Topic - focus on one technique at a time. Want to master RSI alone today? Pick the RSI topic and run through all 40 charts until the pattern becomes instinct.
This structure lets beginners build a foundation through Practice by Topic, then test themselves with Random Practice, and finally challenge themselves in Expert Mode once they feel confident.
XP, Streak & Leaderboard: Learn While You Compete
Learning sticks better when there is a game element. Every time you answer, you collect experience points (XP), and answering every day builds a streak that encourages consistency.
There is also a leaderboard that lets you see how you rank against other players. Its scoring system is designed to measure real accuracy, not just quantity: a correct answer earns +1, a wrong answer is penalised -2, and only your first attempt at each chart counts. This design is important - without the first-attempt rule, someone could replay a chart whose answer they already know to farm points unfairly. With the -2 penalty for wrong answers, guessing randomly also hurts your score, so it encourages you to think before you answer.
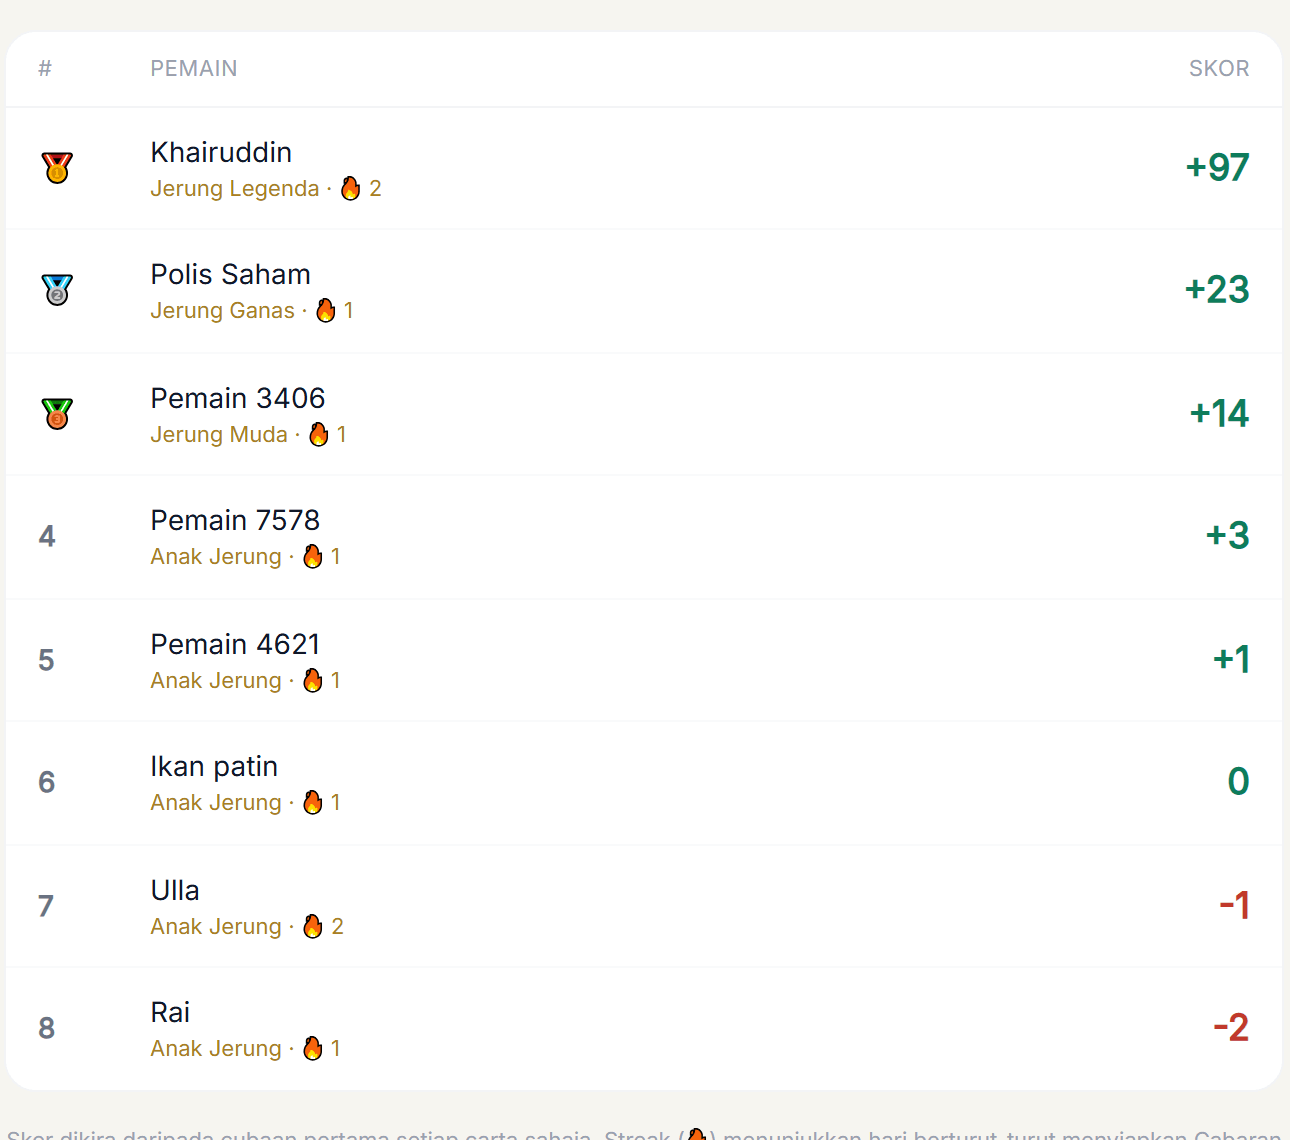
You join the leaderboard by default using your nickname, and there is a control to hide yourself if you prefer to practise privately. Your streak is still tracked and shown as a secondary stat to motivate you to come back every day.
Free vs Gold: What's the Difference?
You can try Chart Game for free. Even visitors who are not logged in can try one demo chart that can be fully revealed - no account needed just to get a feel for how it works. Free registered users can join the Daily Challenge to build a streak and collect XP.
For unlimited practice, Gold members get full access: unlimited practice across all 10 techniques, Expert Mode, and full theoretical explanations for every chart. If you are serious about accelerating your technical analysis learning, full access to 400 charts gives you a far larger "training ground" than a single challenge per day.
5 Tips to Learn Faster with Chart Game
To get the most out of your practice, try these approaches:
- Start with one topic. Don't mix all techniques on day one. Pick one - say Candlestick - and finish all 40 charts until you recognise the pattern without overthinking.
- Read the explanation every time, even when right. The theoretical explanation is where real learning happens. A correct answer by luck is still a knowledge gap that needs closing.
- Protect your daily streak. 10 minutes a day for a month is far more effective than 5 hours once a month. Consistency beats intensity.
- Move up to Expert Mode once confident. When you can identify signals without hints, you are building a skill that transfers directly to real market charts.
- Connect it to your other learning. After practising, try to spot the same patterns on real stock charts you follow. The in-game practice will start to "show up" in the real market.
Remember, technical analysis is not a crystal ball - it is a tool to improve probability, not to guarantee outcomes. Combine it with sound risk management and discipline. To understand how technicals fit into the bigger market picture, read our guide on mastering global sentiment and stock technicals.
Frequently Asked Questions (FAQ)
Is Chart Game free?
Yes. You can try a demo chart without an account, and free registered users can join the Daily Challenge every day. For unlimited practice across all techniques and Expert Mode, you'll need Gold membership.
Is the data in Chart Game real?
Yes, all 400 charts use real Bursa Malaysia price data. Stock names and dates are hidden while you play, then revealed after you answer.
I'm a complete beginner at technical analysis. Can I play?
Yes. In fact, Chart Game is designed for beginners. Start with Practice by Topic for one technique at a time, and read the theoretical explanation after each chart. You'll learn as you play.
What does "no false signals" mean?
Every published chart is only chosen if price genuinely moved the way the technical setup predicts. This ensures you learn the correct pattern first, not a misconception from a failed example.
How is the leaderboard score calculated?
A correct answer is +1, a wrong answer is -2, and only your first attempt at each chart counts. The system rewards accuracy and penalises random guessing.
How many techniques are covered?
Ten techniques: MA Cross, MA50/MA200, RSI, MACD, Bollinger Bands, Breakout, Support & Resistance, Candlestick, Gap, and Volume - each with 40 practice charts.
Does Chart Game replace a technical analysis course?
It complements, not replaces. Courses and articles teach theory; Chart Game trains your eye to recognise patterns in real data. Both work best together.
Conclusion
Reading charts is a skill, and skills are honed through practice, not memorisation. Chart Game by Mahersaham gives you 400 real Bursa Malaysia charts, 10 techniques, four game modes, and a fast feedback loop that accelerates learning - all in one platform that is genuinely enjoyable to use every day.
The best way to start is to try it yourself. Visit Chart Game at mahersaham.com/game and try the demo chart now - see how well-trained your eye already is at reading market signals.
Once you're comfortable reading charts and ready to invest for real, the next step is to open a trading account. Open your CDS account to start investing in Bursa Malaysia as well as foreign stocks such as the US and Hong Kong markets.
And if you're still at an early stage, download the Stock Investing Basics ebook for free to build a solid foundation before entering the market.
Further Reading
- 22 Must-Know Technical Analysis Terms
- Renko, Heikin-Ashi & Point-and-Figure: 3 Chart Alternatives to Candlestick
- 3 Indicators, 1 System: How to Combine Fibonacci, MACD & Ichimoku
- Game Theory & Stock Trading: Why the Simplest Strategy Often Wins
- Market Outlook: How to Master Global Sentiment and Stock Technicals