Technical Analysis (TA) for Malaysian Stock Investors Explained

Introduction
Technical Analysis (TA) is one of the most popular and essential analyses in stock investing, alongside Fundamental Analysis.
TA is a method that studies price movements over a set period by simply looking at charts.
If you think TA is like gambling or just guessing, then there would be no reason for this field of study to exist. However, research has shown that charts display recurring patterns, and this is one of the core principles of TA — history repeats itself.
If you are just starting out in stock investing, you might feel overwhelmed with so many unclear things to learn.
Therefore, in this article, I will explain comprehensively the complete picture of Technical Analysis (TA) to make your learning journey in stock investing easier.
6 Components of Technical Analysis
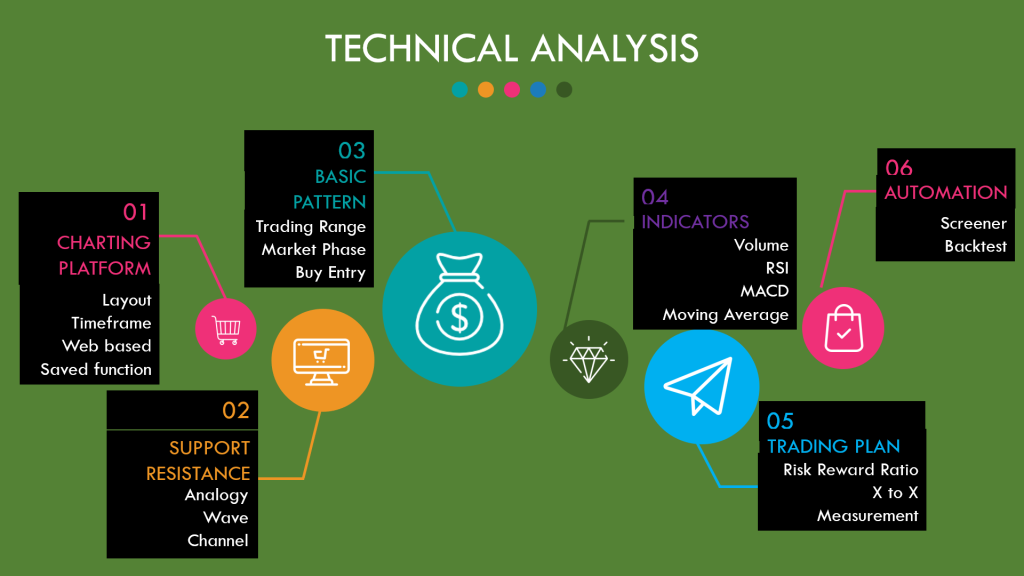
To make things easier to understand, I have broken down Technical Analysis into 6 key components: Charting Platform, Support & Resistance, Basic Patterns, Indicators, Trading Plan, and Automation.
1. Charting Platform
A charting platform is the tool or place where you view charts showing stock prices for your analysis. There are several charting platforms available out there, including TradingView, Bursa Station, Share Investor, Chart Nexus, and also platforms provided by brokers for viewing charts.
At Mahersaham, we use TradingView and encourage all clients to use the same charting platform so that our discussions are smoother and easier to follow.
One of the advantages of using TradingView as your charting platform is that it can be accessed via a browser without needing to download and install any software. You just need to sign up and you can use it from any computer or tablet.
There is also a ''saved function'' — when you log in to your account on a different device, the display and indicators you have drawn previously will still be visible.
2. Support & Resistance
Support and Resistance are the most important topics in Technical Analysis.
Support can be described as a level that is believed to act as a floor where the stock price bounces back upwards if the price is falling and hits that price or zone.
Resistance is the opposite. It is a ceiling where the price bounces back downwards if a rising stock price hits the price or zone believed to be resistance.
If you want a deeper understanding with examples, you can read Support and Resistance for Technical Analysis.
One technique you can use is buying at the support level and selling at the resistance level.
3. Basic Pattern
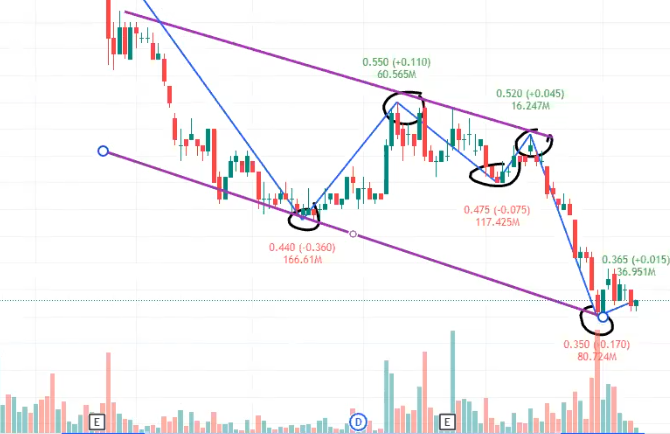
There are many patterns in Technical Analysis, but did you know that within all those patterns, this ''basic pattern'' always exists?
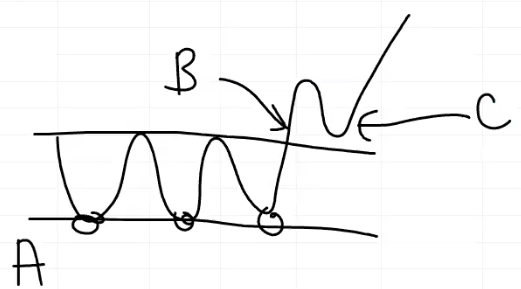
In this basic chart pattern, there are 3 entry options available — A, B, and C as shown in the image above.
- A: Buy At Support (BAS)
- B: Buy On Breakout (BOB)
- C: Buy On Dip/Pullback (BOD)
Different people have different entry points or strategies. But what I can say is, when it comes to risk management between A, B, and C — ranked from lowest risk to highest risk: C > B > A
C is the safest whilst A carries the most risk.
4. Indicators
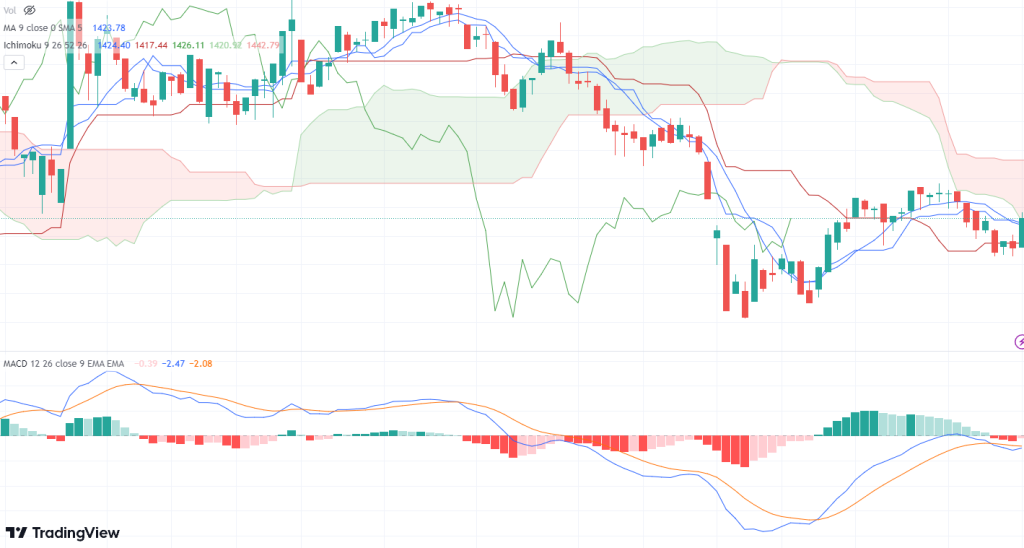
Indicators are tools that can be used to measure and predict price movements. They help traders and investors determine the right time to buy or sell stocks. There are many types of indicators in Technical Analysis, and each indicator has different criteria and calculation methods.
Some popular indicators commonly used are:
- Moving Average (MA): A moving average represents the average stock price over a specific period. For example, a 50-day moving average shows the average stock price over the last 50 days. Moving averages are used to determine trend direction and support and resistance levels.
- Relative Strength Index (RSI): RSI measures the strength and weakness of a stock by comparing price increases with price decreases over a specific period. RSI is commonly used to identify overbought and oversold conditions in the market.
- Bollinger Bands: Bollinger Bands is an indicator that measures market volatility and shows support and resistance levels. Bollinger Bands consist of three lines: the middle line is the moving average, and the upper and lower lines are two standard deviations from the moving average.
- Moving Average Convergence Divergence (MACD): MACD measures the difference between two moving averages with different time periods. This indicator helps traders and investors identify trend changes and market momentum.
Indicators can be used individually or combined to produce stronger analysis. However, do keep in mind that no single indicator can provide a 100% accurate signal.
5. Trading Plan
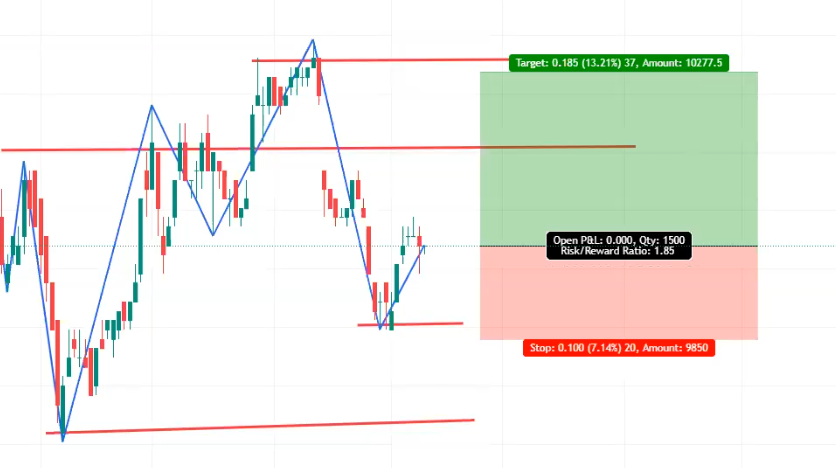
Every time before you want to buy a stock, you need to have a trading plan. What is a trading plan?
A trading plan is your idea of where to buy (entry point, EP) and where to sell — either at a higher price if your trade is successful (target price, TP) or at a lower price if it does not work out, known as the Cut Loss Price (CL).
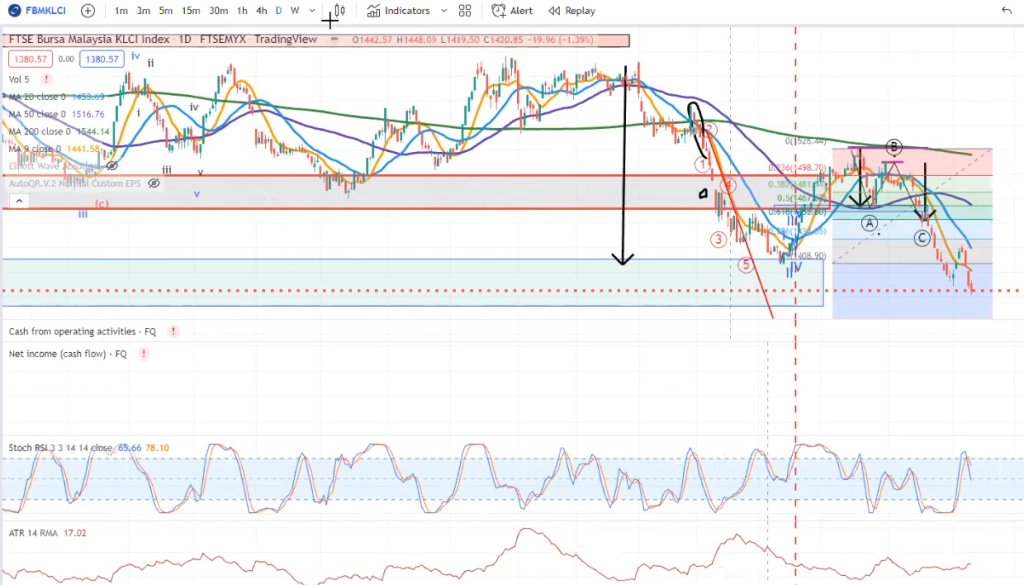
You can measure a good trading plan using the Risk Reward Ratio (RRR). If the risk-to-reward ratio is more than 1.5, that is considered good. The higher the reward, the better. Never buy a stock if the risk exceeds the reward, meaning the ratio is less than one.
The example shown in the image above is a good trading plan because it has an RRR of 1.85.
6. Automation
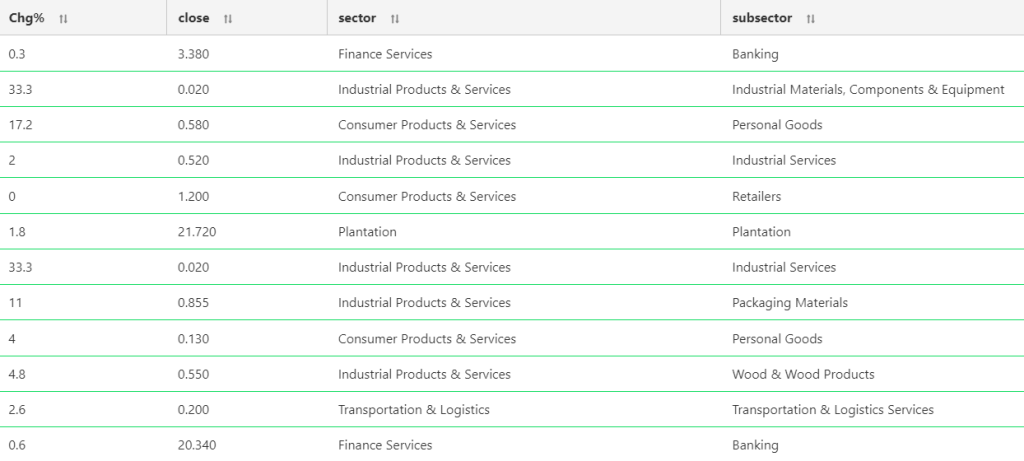
Automation is a step further into the advanced side of technical analysis. This is because it requires additional skills such as programming to find and analyse stock movements in a more advanced manner.
In the stock market, automation refers to the use of technology to carry out some or all of the stock trading process. This includes the use of algorithms and computer programmes to issue buy or sell orders, determine prices, and execute trades quickly without human intervention.
In simple terms, automation can be used for stock screening and backtesting.
With the knowledge we have, we can set up several screeners that combine multiple indicators which we ''feel'' are effective. However, that ''feeling'' needs to be proven through backtesting.
Backtesting is the activity of looking back at how many successes versus failures the screener we created has produced. If the backtest results show more successes than failures, then we can say our screener is reliable and effective for finding potential counters.
Conclusion
Technical Analysis is a method used to analyse stock performance in both the long and short term. This includes using price charts and technical indicators to help traders and investors make accurate trading decisions.
Although technical analysis has its strengths and weaknesses, it remains an important tool in stock trading and is used by many successful investors. With these 6 Components of Technical Analysis, it is hoped that you can more easily understand the overall picture of technical analysis.
FAQ - Technical Analysis
1. What is Technical Analysis (TA)?
Technical Analysis is a method of analysing stock price movements using charts and technical indicators such as Moving Average, RSI, MACD, and others to make buy and sell decisions.
2. What is the difference between Technical Analysis and Fundamental Analysis?
Technical Analysis focuses on price movements and trading volume using charts, whilst Fundamental Analysis evaluates a company''s financial health such as revenue, debt, and asset value.
3. Is Technical Analysis suitable for new investors?
Yes, new investors can start learning the basics of TA. Download the free stock basics ebook to understand the fundamentals before diving deeper into technical analysis.
4. How do I start learning Technical Analysis?
Start by understanding the basics of price charts, support and resistance, and key indicators. Open a CDS account to begin practising with the real market.
Next Steps
Master technical analysis to become a smarter investor. Download the free stock basics ebook for a complete A-to-Z guide. Ready to start? Open a CDS account now and put your TA knowledge into practice in the real market.