Elliott Wave Theory: Understanding Market Rhythm and Structure
Elliott Wave Theory is among the most influential technical analysis concepts in the world of investing and trading. Whether you are a long-term trader, an institutional investor, or an active scalper, understanding the wave structure of the market is a crucial step to avoid the mistake of trading against the primary trend.
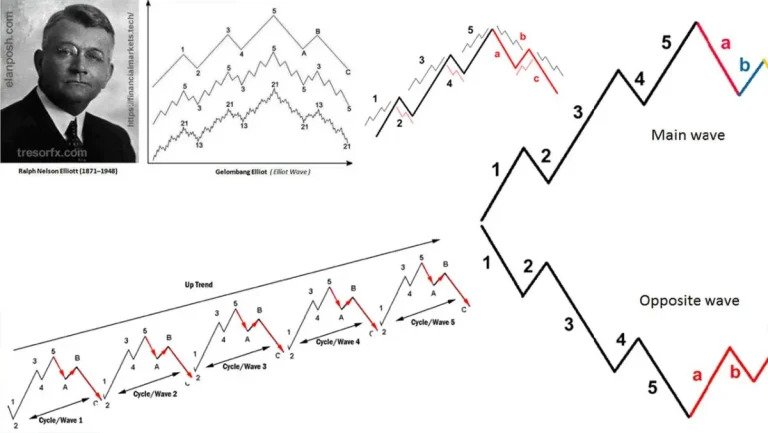
Introduced by Ralph Nelson Elliott (1871–1948), this theory originated from his observations of repetitive price movement patterns in financial markets. Elliott argued that price movements do not occur randomly; rather, they form through waves that reflect the collective psychology of market participants — oscillating between optimism and pessimism.
Fundamental Concepts and Application
Elliott Wave is not merely an analytical tool, but also a framework for understanding market behaviour. It helps investors and traders comprehend where the current price sits within the market cycle — whether at the early stage of a new trend, in the middle, or in a correction phase.
Generally, this theory classifies price movements into two main categories:
- Impulsive waves — price movements that align with the direction of the primary trend.
- Corrective waves — temporary counter-trend movements before the primary trend resumes.
By identifying the wave currently in play, traders can assess trend continuation potential, reduce the risk of entering positions at unsuitable times, and improve overall risk management efficiency.
Added Value for Traders and Investors
For many investors, the main challenge is not simply identifying the trend direction, but understanding which phase the market is currently in. Elliott Wave offers a visual guide and structural framework to answer this question.
Through this theory, one can:
- Determine the number of phases or waves that have formed and are yet to form;
- Identify the current price phase;
- Anticipate the next price movement; and
- Plan strategies before, during, and after a trade setup materialises.
The strength of this theory lies in its adaptability to various trading styles — whether aggressive or conservative — depending on the investor's risk tolerance and objectives.
Strengths and Practical Learning
Although the theory may appear complex and time-consuming to master at first, its effectiveness is proven when applied consistently. Using wave counts on charts helps reduce subjective decisions and emotional bias in trading.
Many professional traders incorporate Elliott Wave as a key component in their technical analysis, alongside other methods such as Fibonacci retracement, trendline analysis, and momentum indicators. This combination enables them to evaluate the market more comprehensively and strategically.
Elliott Wave Requires Continuous Practice
Mastering Elliott Wave Theory requires continuous practice and careful observation of market patterns. Although it appears complicated at first, the ability to "read waves" provides a significant advantage in understanding market psychology and long-term price movements.
Before getting started, investors are advised to prepare notes or chart sketches to help visualise wave structures. Once this concept is fully understood, Elliott Wave can become an essential tool in enhancing the accuracy of technical analysis and building confidence in investment decisions.
Frequently Asked Questions (FAQ)
What is Elliott Wave Theory?
Elliott Wave Theory is a technical analysis method that studies wave patterns in market prices. The theory states that markets move in cycles of 5 impulsive waves and 3 corrective waves.
How many waves are in one Elliott Wave cycle?
A complete cycle consists of 8 waves — 5 impulsive waves following the direction of the primary trend, and 3 corrective waves moving against the trend direction.
What indicators pair well with Elliott Wave?
Elliott Wave is often combined with Fibonacci retracement, trendline analysis, and momentum indicators to improve the accuracy of analysis.
Is Elliott Wave suitable for beginners?
Elliott Wave requires continuous practice and careful observation. Although it appears complicated at first, it provides a significant advantage in understanding market psychology.
Understanding market wave structure helps you make more strategic trading decisions.
Open your CDS account via Register for an Mplus CDS Account to start trading stocks on Bursa Malaysia.
Just starting to learn about stocks? Download the Free Stock Basics Ebook to understand the fundamentals of stock investing before you begin.
Further reading: