How to Use Fibonacci Retracement in Stock Analysis
History and Origins
Fibonacci, also known as Leonardo Bonacci, was an Italian citizen born in the year 1170.
He was one of the most talented individuals in the field of mathematics at that time.
In simple terms, Fibonacci was an Italian mathematician.
Fibonacci Numbers (Fn)
In brief, Fibonacci numbers are the sum of the two preceding numbers, starting with 0 and 1.
The initial sequence is:
0, 1, 1, 2, 3, 5, 8, 13, 21, 34... and so on.
Do you follow?
The formula is as follows:
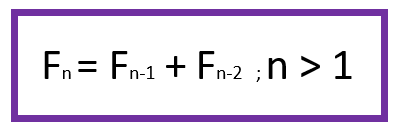
Starting with the numbers 0 and 1.
How do we determine the next number?
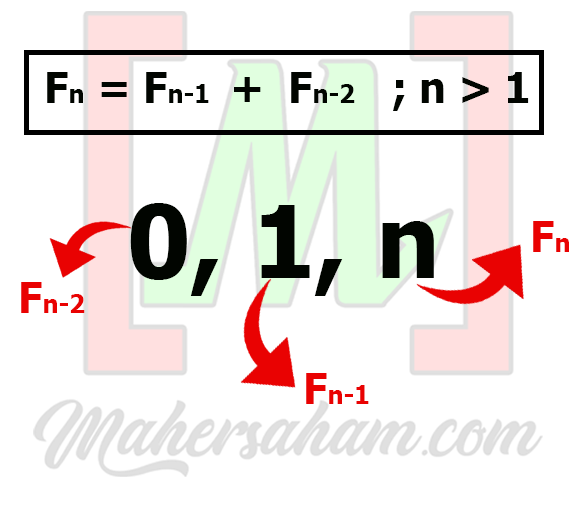
Based on the diagram above, the value of n equals 1 + 0 = 1
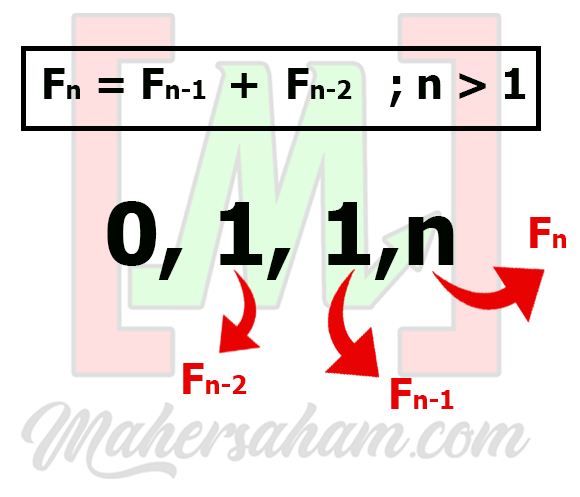
After that, to find the next number we repeat the same step as above, so n equals 1 + 1 = 2.
This is how the subsequent steps work to obtain Fibonacci numbers.
These numbers form a sequence known as Fibonacci sequences.
Fibonacci sequences may look simple, right? But in reality, Fibonacci sequences are incredibly powerful.
Why do I say that? Refer to the diagram below.
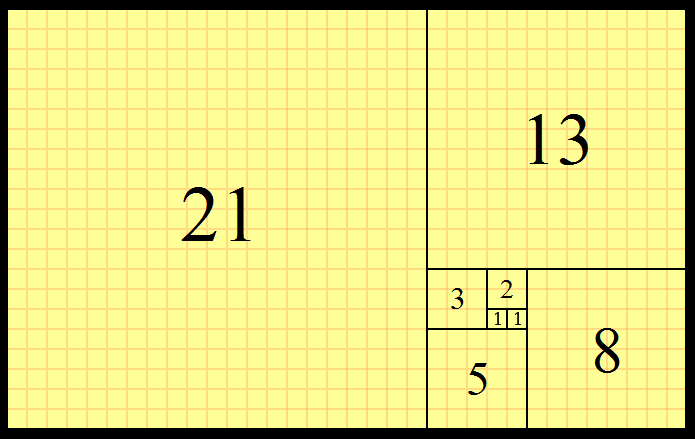
Tiles with squares whose side lengths are successive Fibonacci numbers: 1, 1, 2, 3, 5, 8, 13, and 21.
Remarkable, is it not?
This theory would be impossible to derive without deep knowledge in mathematics.
No wonder Fibonacci is hailed as a great Italian mathematician.
That is not all — Fibonacci sequences can also be found in nature.
- Flowers
- Tree branches
- Fruits
- Vegetables
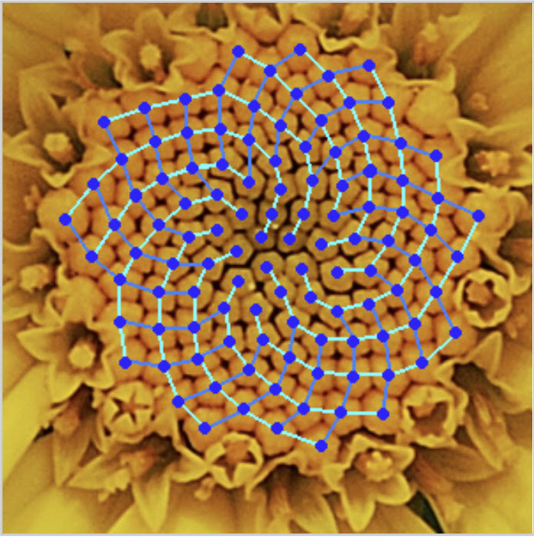
The yellow Chamomile flower above demonstrates an arrangement of 21 (blue) and 13 (aqua) spirals.
Such sequences involving Fibonacci numbers appear in various types of plants.
Kepler (German astronomer and mathematician) demonstrated the presence of Fibonacci sequences in nature.
The Fibonacci sequence is used to explain the golden ratio in the pentagonal shapes of certain flowers.
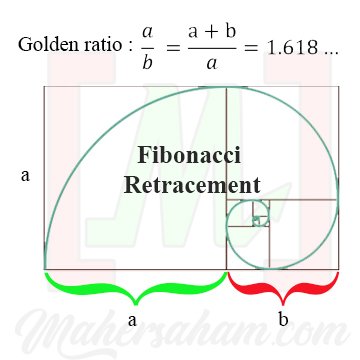
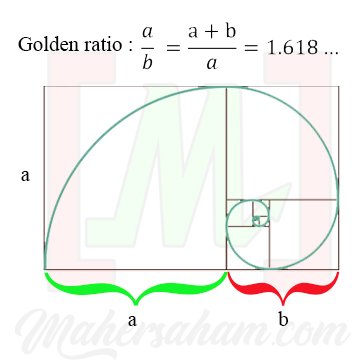
Golden Ratio
What is the golden ratio?
In mathematics, the golden ratio is a form with a ratio of 1:1.618.
The golden ratio is an exceptionally special element in mathematics.
It is a term used to describe how elements in a work of art can be placed in the most aesthetically pleasing manner (a branch of philosophy that studies concepts related to beauty and taste).
In brief, the golden ratio is a ratio considered to represent a perfect composition.
The value of the golden ratio is 1 : 1.618
Some also consider 0.618 to be the golden ratio.
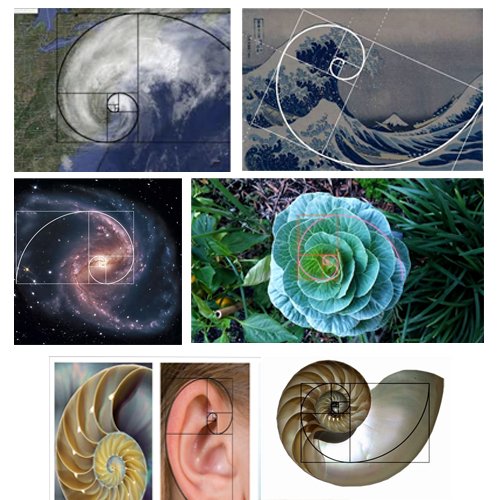
Golden Ratio Examples
Fibonacci Retracement
In finance, Fibonacci retracement is a method of technical analysis used to determine support and resistance levels.
It is named after the use of Fibonacci sequences.
So what exactly is a retracement?
When a stock price has risen and then begins to fall, that downward movement is referred to as a retracement or pullback.
When we enter a particular counter or wish to buy a particular stock, we naturally want to buy at a low price and then sell at a high price.
So, how do we analyse whether the stock we are buying is already at a low price or not?
We certainly use technical analysis.
When employing technical analysis, we sometimes make several predictions based on behaviours that have occurred previously.
For example, the existence of previous support and resistance levels.
We use resistance as an indicator that the stock price has the potential to rise to that level.
This is because such a pattern has occurred before.
Fibonacci retracement is one method for us to predict where the price is heading.
It helps us in predicting where a stock may fall and where it might potentially rebound.
However, it must be remembered that predictions are not always correct and accurate.
We cannot claim that the Fibonacci Retracement technique is 100% accurate.
That is precisely why we must continually study and acquire knowledge.
Practical Guide Using TradingView
First: Visit tradingview.com and then click on the chart.
Second: Follow the steps as shown in the diagram below.
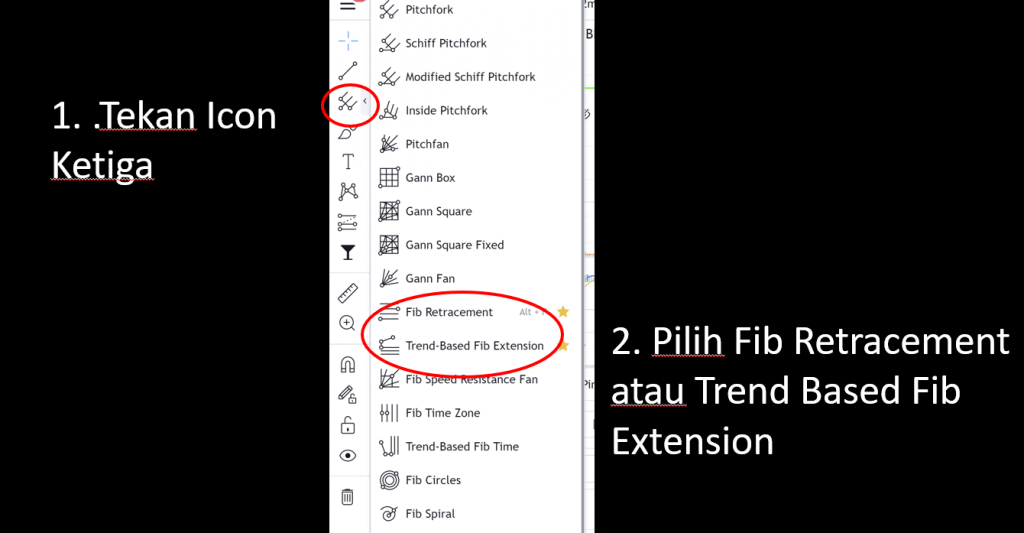
Fib Retracement Tool
Next, select the counter you wish to analyse.
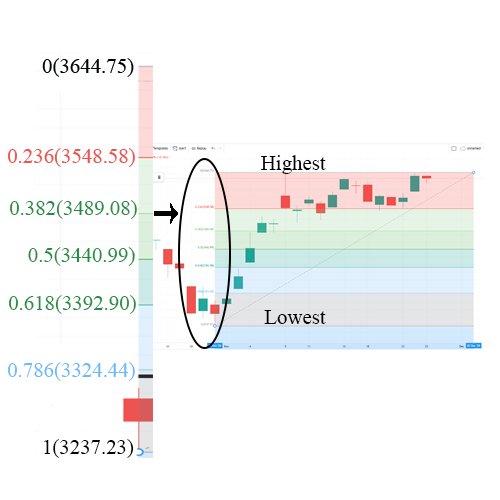
Select two points: the highest price and the lowest price.
Then drag from the lowest price to the highest price. You will see something similar to the diagram above when using Fibonacci Retracement.
Ensure that number 1 is at the bottom and number 0 is at the top.
Between numbers 0 and 1 are the Fibonacci points. If a stock falls to the 0.5 and 0.618 levels, there is a tendency for it to rebound.
Why?
Because points 0.5 and 0.618 are the golden ratio points.
New to Stock Investing?
Want to learn about stocks? Want to know more?
But not sure where to start?
Do not worry — Mahersaham is here to help.
Download the free Mahersaham ebook now!