How to Use On Balance Volume (OBV) Oscillator in TradingView

In this article, we will learn how to use the On Balance Volume (OBV) oscillator in TradingView for stock technical analysis.
Have you read our article on How to Register a TradingView Account and Create a Template?
After reading it, do create your TradingView account straightaway.
Then you can practise the technical analysis that Mahersaham teaches live on Facebook and YouTube.
For those who already have a TradingView account, go ahead and log in — let us learn how to use the On Balance Volume oscillator in TradingView.
What Is On Balance Volume (OBV)?
On Balance Volume is a technical analysis technique that uses volume movement to anticipate changes in stock prices.
This technique was introduced by Joseph Granville in 1963.
He also authored a book titled Granville''s New Key to Stock Market Profits.
What he stated was this:
Volume plays a crucial role in driving prices in the stock market.
If the volume is large, then the stock price also has the potential to move significantly.
OBV is used to detect large-scale volume movements.
Why do we want to detect large volume movements?
Volume is like a spring being compressed — what happens when it is released?
It will surely bounce back rapidly.
Granville believed that when volume increases sharply without any significant change in the stock price, the price will eventually surge upwards or plunge downwards.
If the volume is buying volume and we then release it, the price will rapidly surge upwards.
Conversely, if the volume is selling volume and we then release it, the price will rapidly plunge downwards.
Why Do We Use the On Balance Volume Oscillator?
There are two main purposes:
- To confirm the trend — whether it is an uptrend or downtrend.
- To identify reversals.
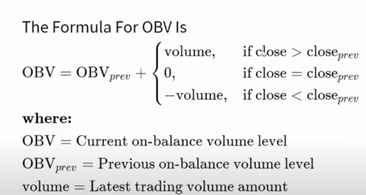
The image above shows the formula explaining how OBV works.
Do not worry — you do not need to memorise the formula.
On Balance Volume in TradingView
As usual, log in to TradingView.
After logging in, click on the Chart section.
You will then see the display shown below.
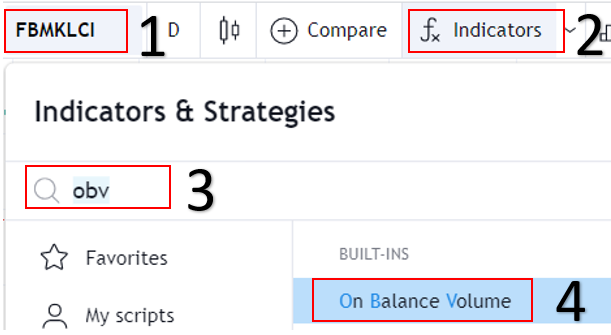
As shown in the image above, follow these steps:
- 1. Enter the name of the counter (stock) you wish to analyse.
- 2. Click the Indicator button.
- 3. Type the indicator you wish to use (On Balance Volume for this tutorial).
- 4. Click on the indicator.
After that, your TradingView will look like this:
How do we read it?
Refer to the image below.
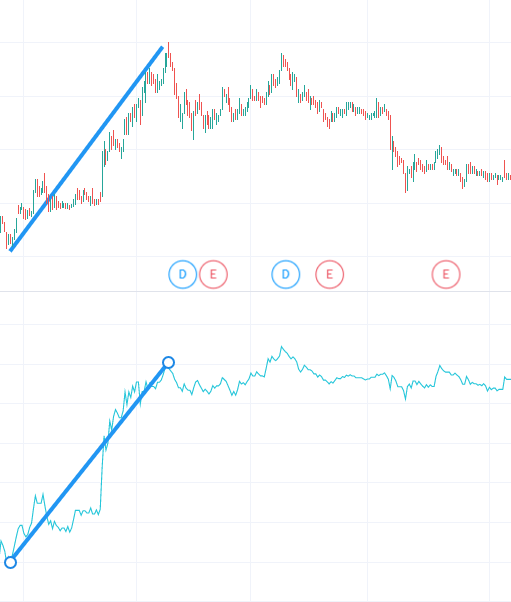
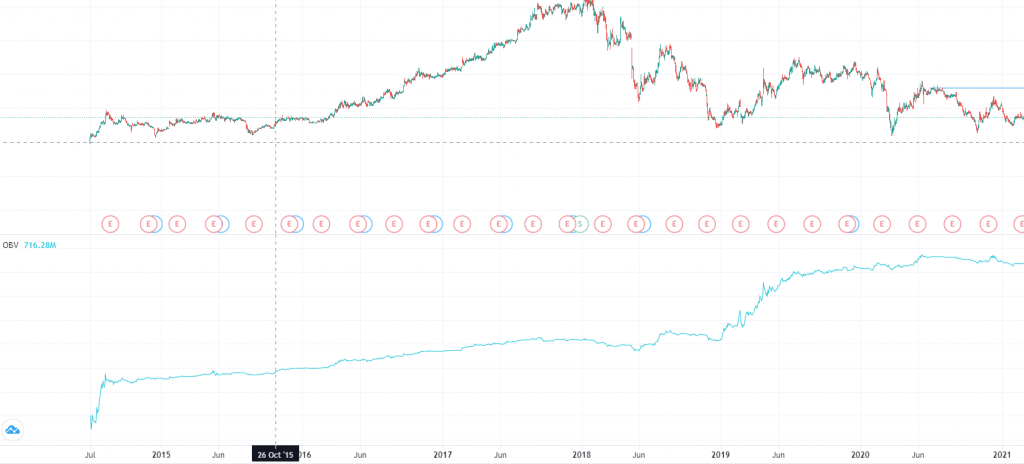
The candlestick chart at the top represents the stock price movement, whilst the line chart at the bottom represents the OBV oscillator.
At a glance, we can tell that the stock price is rising or in an uptrend (focus on the blue line in the candlestick chart).
To confirm this, we look at the OBV.
If the OBV is also rising, it is a sign that the counter is genuinely making an upward move.
Simple.
That is how you confirm a trend.
How do we identify a trend reversal?
When the OBV clashes with (diverges from) the uptrend, that is the sign of an impending trend reversal.
You can see the example below.
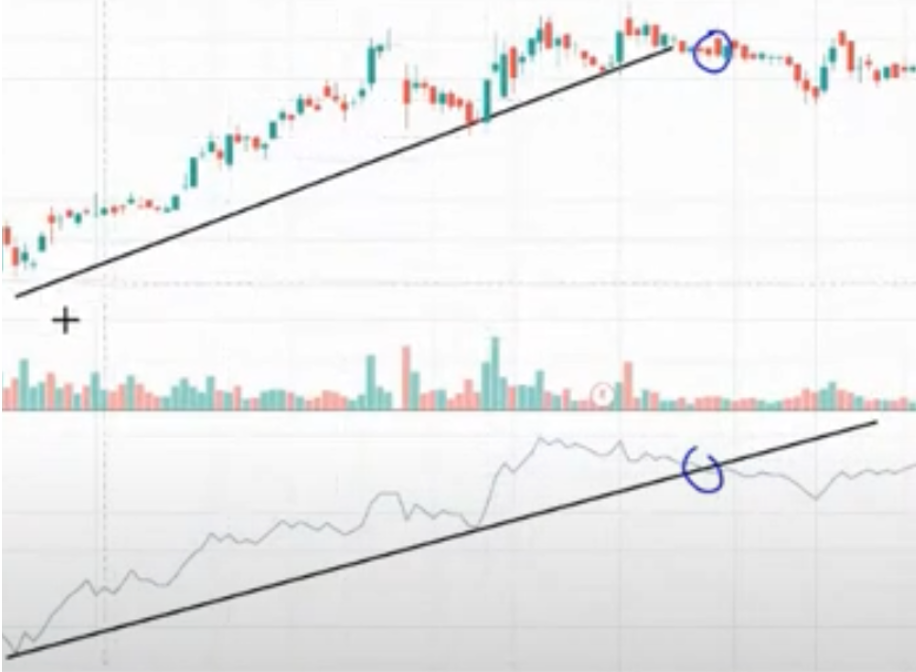
Based on the case study above, the black line represents the uptrend line.
Then the OBV clashed with that line at the circled area.
So what happened after that?
You can see that a downtrend occurred afterwards.
It reversed from an uptrend to a downtrend.
TradingView Is a Key Component of Technical Analysis
This article is one of the articles written in the Technical Analysis: TradingView series. Technical analysis is one of the branches of stock research.
There are many more topics covered in the technical analysis learning series and how you can use TradingView optimally to help you conduct stock research.
To view other topics related to TradingView or Technical Analysis, head over to the Complete Technical Analysis Guide.
Conclusion
Through the On Balance Volume oscillator, we can confirm trends — whether it is an uptrend or downtrend — and also identify trend reversals.
We conclude this article with a video tutorial on how to use the On Balance Volume Oscillator.
Frequently Asked Questions (FAQ)
1. What is On Balance Volume (OBV)?
On Balance Volume (OBV) is a technical analysis oscillator that measures buying and selling pressure based on trading volume. It helps investors identify the direction of stock price trends.
2. How do you read OBV signals?
When OBV is rising, it indicates strong buying volume (uptrend). When OBV is falling, it indicates strong selling pressure (downtrend). Divergence between OBV and price can signal a reversal.
3. Can OBV be used on its own for trading decisions?
It is not recommended. OBV should ideally be used alongside other indicators such as Moving Average or RSI to obtain stronger confirmation before making trading decisions.
4. How do I add OBV in TradingView?
Open TradingView, click on the Indicators button, search for "On Balance Volume" in the search box, and click to add it to your chart. OBV will be displayed at the bottom of your chart.
Start Investing Today
If you are serious about investing in stocks, the first step is to open a CDS account with Mahersaham today. You can also download the free stock ebook to understand the fundamentals of stock investment from the very beginning.