How to Use Pivot Point Indicator on TradingView
Assalamualaikum and greetings to all loyal readers of the Mahersaham blog.
How are you doing?
Wishing you all good health alongside your beloved family.
Have you ever heard about the Pivot Point indicator?
Never?
Seriously?
Well, that''s exactly why today I want to share a little about this indicator.
InshaAllah, we will learn something new.
As usual, before we start learning about stocks, we need a calm mind.
Make sure you are in a conducive environment.
Ready?
Let''s begin.
Bismillah.
What is the Pivot Point Indicator?
Pivot Point is one of the indicators widely used in the stock market.
This indicator provides special support and resistance levels.
It uses the previous low price, high price, and closing price to determine upcoming support and resistance levels.
That is also why the Pivot Point indicator is known as a leading indicator.
How does the calculation work?
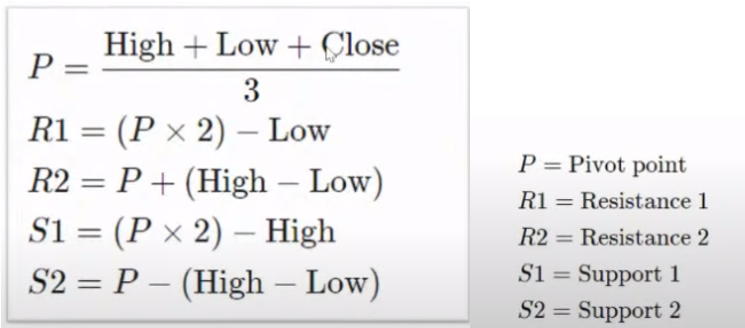
Don''t worry, you don''t need to memorise this formula.
I''m sharing it for your knowledge.
Pivot Point Indicator in TradingView
Sign in to your TradingView account.
If you don''t have a TradingView account yet, you can refer to the article How to Register a TradingView Account and Create a Template.
After you have logged in to TradingView, click on the chart section.
Then the display below will appear.
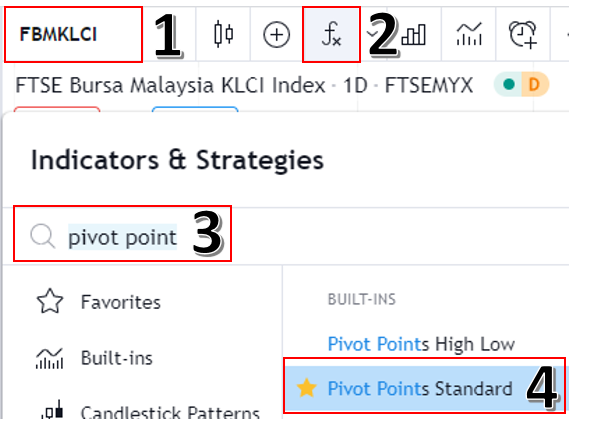
As shown in the image above, you can follow the steps stated.
- 1. Enter the name of the counter you want to study.
- 2. Click the indicator button
- 3. Type the indicator you want to use (Pivot Points Standard for this time)
- 4. Click on that indicator
After that, your TradingView will look like this.
Confusing, isn''t it?
Too many lines, right?
What should you do?
Click the gear-shaped icon as shown in the image below and change the pivot number to a smaller value.
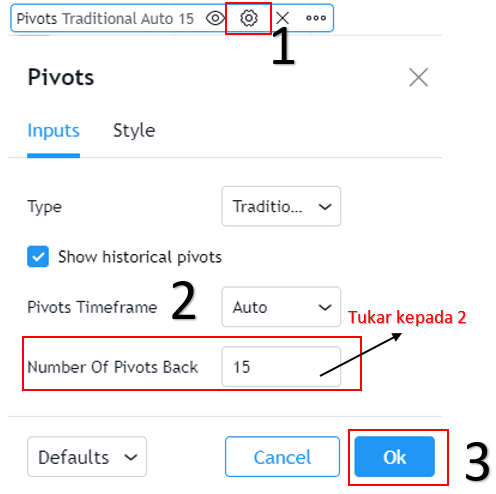
In this article, we will only use 2 pivot numbers.
Then click OK.
Your chart will look much cleaner.
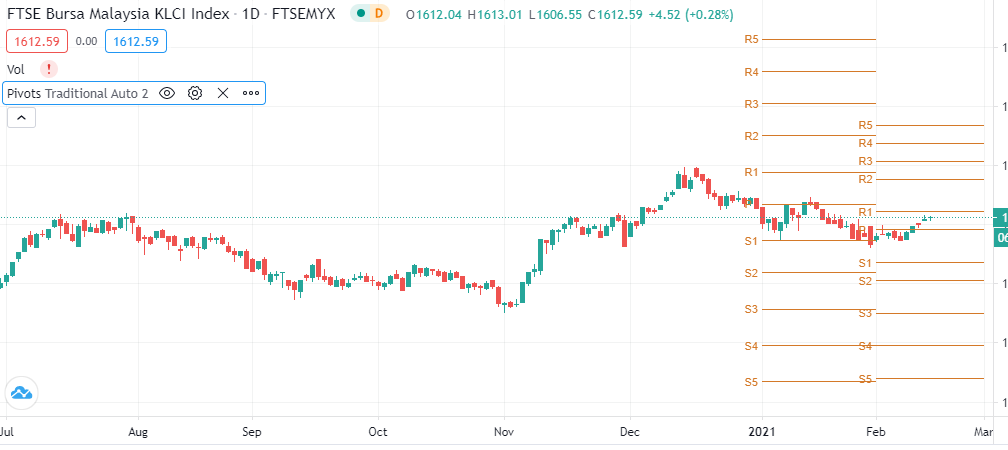
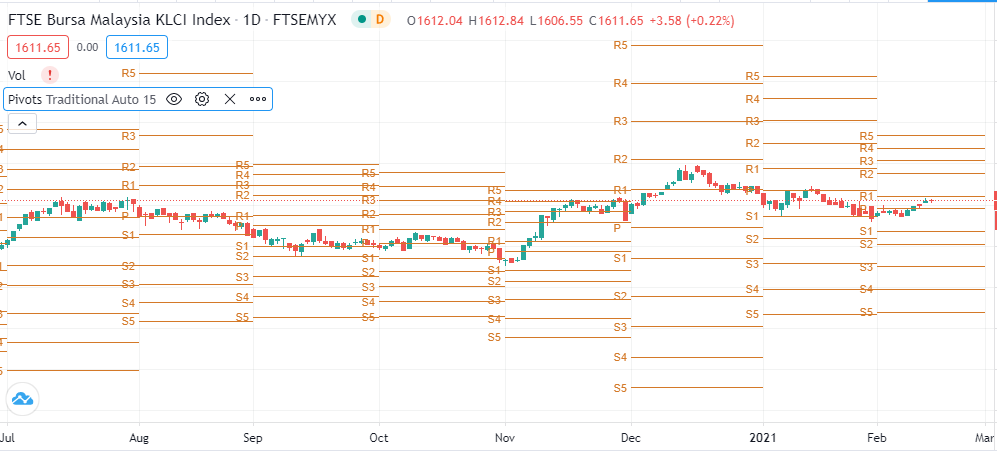
Do you notice the many lines?
Let me zoom in a bit on that image.
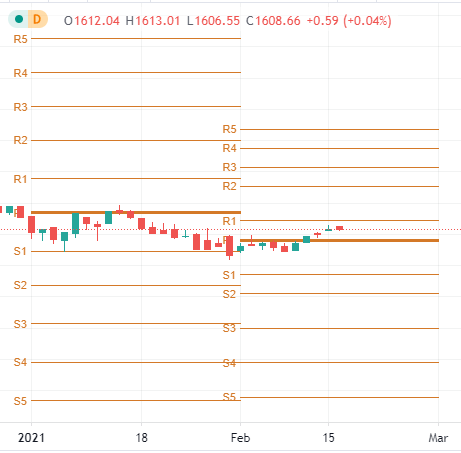
The middle line is the pivot point.
Followed by 5 lines above (R1, R2, R3, R4, R5 or known as resistance) and 5 lines below (S1, S2, S3, S4, S5 or known as support).
The pivot point above represents the forecast for one month.
If you look at the image above, there are lines on the left and right.
The left lines are for January whilst the right lines are for February.
Each line for each month, whether it is the Pivot Point, resistance, or support, will never change.
However, different timeframes will give different pivot points.
How do you read it?
Right now, the pivot point acts as the middle ground.
If the price is below the pivot point line, we can say the counter is bearish for that month.
Conversely, if the price is above the pivot point line, we can say the counter is bullish for that month.
Besides that, we can also use each resistance level as a take profit (TP) point and each support level as a cut loss (CL) point.
If your TP is at R1, then your CL is at S1, and so on all the way to R5 and S5.
Why set multiple TP levels?
Because every person has their own strategy that they have studied.
For example, Puan Taichy buys 100 lots of XYZ stock.
When the stock price hits TP1 at R1, she plans to sell a quarter, which is 25 lots.
Then when the stock price hits TP2, she plans to sell another quarter, and so on.
That is one of the strategies she uses.
TradingView Is an Important Component of Technical Analysis
This article is one of the articles written in the Technical Analysis: TradingView series. Technical Analysis is one of the branches related to stock research.
There are many more topics covered in the technical analysis learning series and how you can use TradingView optimally to help you do research on stocks.
To see other topics related to TradingView or Technical Analysis, head to the Complete Technical Analysis Guide.
Conclusion
Do we need to learn every single indicator?
Or can we choose indicators that suit our own preference?
Let me put it simply.
The more we learn, the more research we can do.
And the more conclusions we can draw.
The analogy is like answering a maths question - we can prepare various types of solutions and formulas.
The more formulas we know, the more solutions we can provide.
It is up to you which one to use.
Some people only use one indicator to make consistent profits.
Others combine several indicators to make consistent profits.
What is important is that you seek the right stock market knowledge.
The more you study, the more knowledge you will have.
I end this article with a learning video on how to use the Pivot Point indicator.
Frequently Asked Questions (FAQ)
1. What is the Pivot Point indicator in stock analysis?
Pivot Point is an indicator that calculates support and resistance levels based on the highest, lowest, and closing prices of the previous trading session. It is used to identify potential price reversal points.
2. How do you use Pivot Point on TradingView?
Click the Indicators button on TradingView, search for Pivot Point and select the type you want such as Traditional or Fibonacci. The indicator will automatically display S1, S2, S3 and R1, R2, R3 levels.
3. What is the difference between Traditional and Fibonacci Pivot Point?
Traditional Pivot Point uses simple mathematical formulas to calculate support and resistance levels, whilst Fibonacci Pivot Point incorporates Fibonacci ratios for more precise level calculations.
4. Can Pivot Point be used for intraday trading?
Yes, Pivot Point is very popular for intraday trading because it provides clear price levels for entry and exit. Many traders use it together with other indicators for signal confirmation.
Want to start investing in stocks? Open a CDS account with Mahersaham today. Download our free stock basics ebook for a complete guide!