Master Intraday Trading with Multi-Timeframe Analysis
In intraday trading, timing is everything. Enter too early, and the market might "shake out" your position. Enter too late, and the main move has already ended.
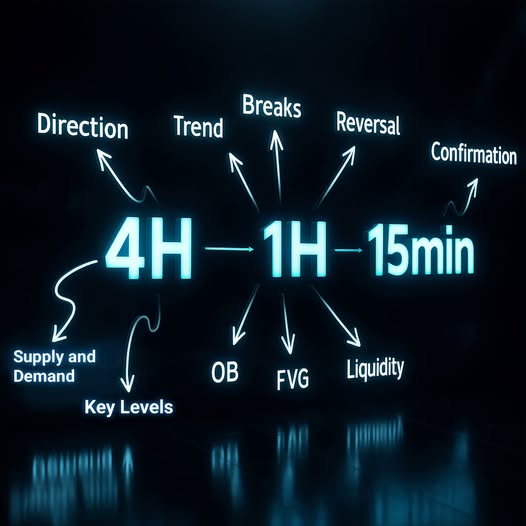
This is where multi-timeframe analysis becomes your saviour. By combining the perspective of a higher timeframe with execution on a lower timeframe, traders can enter with greater precision whilst staying aligned with the market''s direction. The diagram above summarises the flow: 4H -> 1H -> 15min
Step 1: 4-Hour Chart – The Big Picture
The 4-hour timeframe is like a compass. It shows the main direction of the market.
Direction – Is the market in a bullish, bearish, or sideways condition?
Trend – Identify whether price is making higher highs/higher lows or vice versa.
Supply and Demand Zones – Areas where strong price movements originated, typically forming robust support or resistance levels.
Key Levels – Round numbers, previous highs/lows, or significant institutional levels.
Simply put, the 4H chart is like a map before you begin your journey.
Step 2: 1-Hour Chart – Structure and Setup
After establishing the direction from the 4H, we zoom into the 1H for a more detailed setup.
Order Block (OB) – Areas where large institutions place their orders.
Fair Value Gap (FVG) – An imbalance gap between buyers and sellers that price typically returns to fill.
Liquidity Pools – Areas where stop orders accumulate, usually above highs or below lows.
Breaks & Reversal – Watch for structural breaks indicating either trend continuation or signs of reversal.
This timeframe acts as a bridge – from the larger bias (4H) to a clearer course of action.
Step 3: 15-Minute Chart – Execution and Confirmation
Finally, drop down to the 15-minute chart to plan your actual entry.
Reversal Signals – Candlestick patterns, long wicks, or momentum shifts that align with the larger bias.
Confirmation – Do not rush. Wait for the 15-minute chart to confirm the narrative from the 4H and 1H.
Entry & Risk Management – Enter at levels that offer the best risk/reward ratio, using nearby liquidity or imbalance zones.
This is where you "pull the trigger". The smaller timeframe provides additional confidence whilst tightening your stop loss.
Why This Technique Works
Markets are fractal in nature. The same patterns appear across all timeframes; only the level of significance differs.
The 4H gives confidence in direction.
The 1H provides a structural map.
The 15min delivers precise entry timing.
Combining all three prevents you from being swept away by market noise and enables you to ride the actual move.
FAQ About Multi-Timeframe Intraday Trading
What is multi-timeframe analysis in intraday trading?
Multi-timeframe analysis is a technique that combines perspectives from several different timeframes (4H, 1H, 15min) to gain a complete picture of the market. The 4H shows the main direction, the 1H details the setup structure, and the 15min is used for precise entry.
Why use three timeframes simultaneously?
Markets are fractal in nature — the same patterns appear across all timeframes. By combining the 4H (direction), 1H (structure), and 15min (timing), you can avoid market noise and enter at the best risk/reward level.
What are common mistakes made by intraday traders?
The most common mistake is entering a trade without referencing the higher timeframe. Traders who only focus on the 15min without understanding the bias from the 4H and 1H often get caught in shakeouts or enter too early before the actual trend begins.
Is the multi-timeframe technique suitable for beginners?
Yes, this technique is suitable for all levels of investors as it builds trading discipline. Starting with the big picture (4H), refining with structure (1H), then executing on the smaller timeframe (15min) makes the decision-making process more systematic.
Want to deepen your intraday trading skills with multi-timeframe analysis?
Open a CDS account through Register for a CDS Account with Mplus to start trading stocks on Bursa Malaysia.
New to stocks? Download the free Stock Basics Ebook to understand the fundamentals of investing.
Further reading: