Introduction to Candlestick — Trade Based on What You See, Not Guesswork
Candlestick Is Not Something New
Many people think candlestick charts are a modern invention, but this technique actually originates from Japan and has existed since the 1700s. A rice trader named Homma from Japan was among the earliest to use this method for market analysis.
Why Do Traders Favour Candlestick?
Candlestick is like an ''X-ray'' for the market. With just one glance, you can already tell:
- Who is currently dominant — buyers or sellers
- Market emotions — panic, greed, fear, or confidence
- The next direction — possibly a reversal, possibly a trend continuation
Compared to regular bar charts, candlestick is far easier to read visually. One look and the price story is immediately clear.
How Does Candlestick Work?
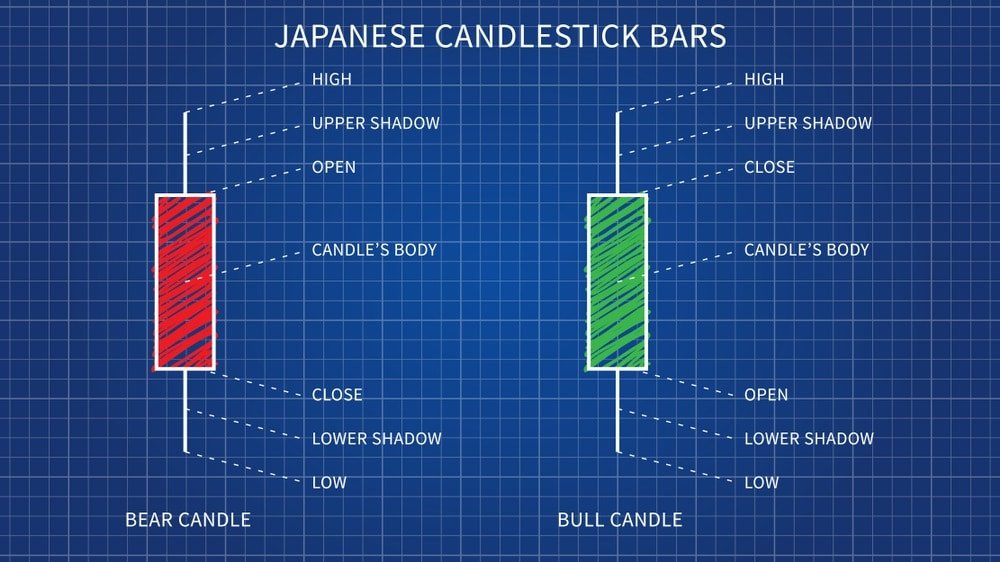
Each candlestick bar displays 4 key pieces of information:
- Open price
- High price
- Low price
- Close price
The body is the space between the open and close. If the close is higher than the open, the body is white/hollow (bullish). If it is the opposite, it will be black/filled (bearish).
The shadow/wick is the upper and lower tail — showing the highest and lowest price range within a single session.
What Do Candle Colour and Size Mean?
- A long white candle → buyers are in control, strong upward momentum
- A long black candle → sellers are in control, strong selling pressure
- A long upper shadow → price tried to rise but was pushed back down
- A long lower shadow → price tried to fall but buyers pushed it back up
All of these give us "hints" about what is happening in other traders'' minds.
Context Matters — Read Multiple Candles
A single candle is not enough. It is merely a fragment of the story. But when you observe several consecutive candles, the patterns and market direction become visible.
For example: A hammer candle at the bottom of a downtrend may signal a reversal, but if it appears in the middle of a trend, it may not mean anything significant.
More Than Just Patterns
Candlestick is not merely about shapes or patterns. It is a reflection of emotions in the market — fear, greed, patience, confidence. When we read candlestick correctly, we are actually reading human reactions to price movements.
Steve Nison emphasised that candlestick is not meant to replace Western analysis, but to complement it. Combine both approaches — Western technical analysis and Japanese candlestick — and your analysis becomes more robust and sharp.

Frequently Asked Questions (FAQ)
What is a candlestick in stock trading?
A candlestick is a price chart display method originating from Japan since the 1700s. Each candle shows the open, close, high, and low prices within a specific time period, providing a visual picture of price movement and market sentiment.
What is the difference between a green/white candle and a red/black candle?
A green or white candle means the closing price is higher than the opening price, indicating strong buying pressure. A red or black candle means the closing price is lower than the opening price, indicating that selling pressure dominates the market.
Is a single candlestick enough to make a trading decision?
No. A single candlestick only provides part of the story. You need to observe several consecutive candlesticks in the context of the current trend to identify patterns and make more accurate trading decisions.
Can candlestick be used together with Western technical analysis?
Yes, and it is in fact encouraged. Steve Nison himself emphasised that candlestick is not meant to replace Western analysis, but to complement it. Combining both approaches results in more robust and sharper analysis.
Understanding candlestick is an essential foundation in technical analysis for every serious investor and trader.
Open your CDS account today through our step-by-step guide here to start investing in the stock market.
Download the free stock basics ebook to learn the fundamentals of stock investing from scratch.