Let the Chart Speak the Language of the Market: 5 Technical Indicators Successful Traders Use

Have you ever felt like you "missed the train" when a stock suddenly shot up, but you didn''t get in on time? Or perhaps you bought in when the price looked attractive... only for it to plunge the very next day? Many traders — including seasoned veterans — have experienced the exact same thing.
In the world of trading, decisions made without data are like guessing in the dark. And this is where technical analysis plays a crucial role. But don''t worry — you don''t need to be a maths genius to get started. You just need to know how to read the "language of the chart".
How do you understand this language?
Use technical indicators — tools that help you identify trend direction, momentum, entry/exit points, and key price levels. In this article, we will uncover the 5 most effective indicators frequently used by successful traders. When used correctly, these five "weapons" can help you make smarter decisions and reduce the risk of losses.
Let us dive into each one.
1. Moving Averages (SMA & EMA)
What Is It For?
Moving averages help you see the direction of the market trend and "filter out" erratic price movements.
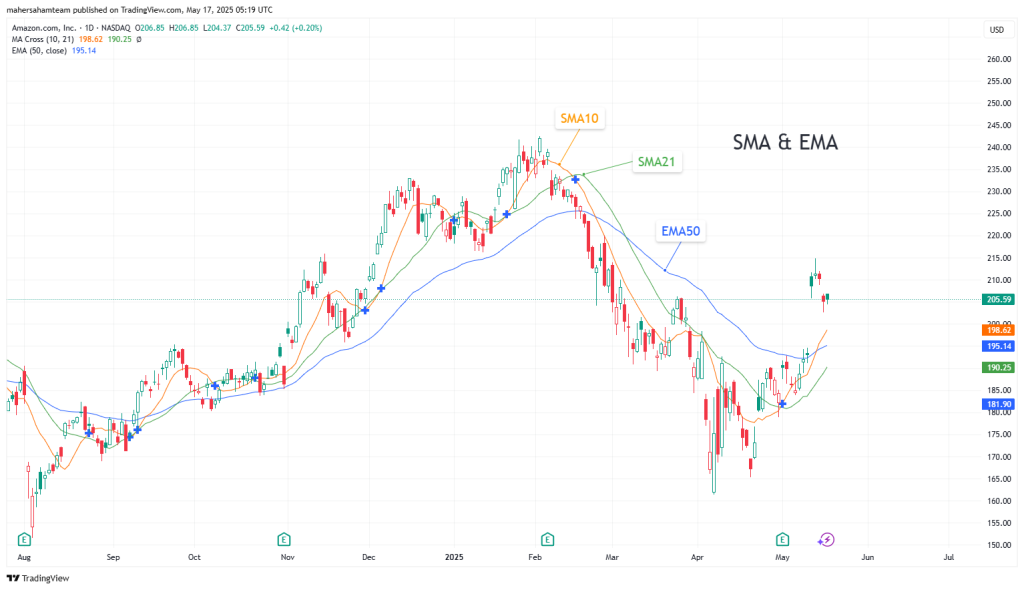
How Is It Used?
- If the moving average line is rising, it signals an uptrend.
- If it is flat, the price may be moving sideways.
- It is also used as support and resistance zones.
Popular Strategy:
The crossover strategy — for example, when the 50-day MA crosses above the 200-day MA (Golden Cross), it signals a buy. When it crosses below (Death Cross), it signals a sell.
Advantages:
- Helps identify trends clearly
- Reduces emotional decision-making
- Can be backtested with historical data
2. RSI – Relative Strength Index
What Is It For?
RSI measures momentum and identifies whether a stock is overbought or oversold.
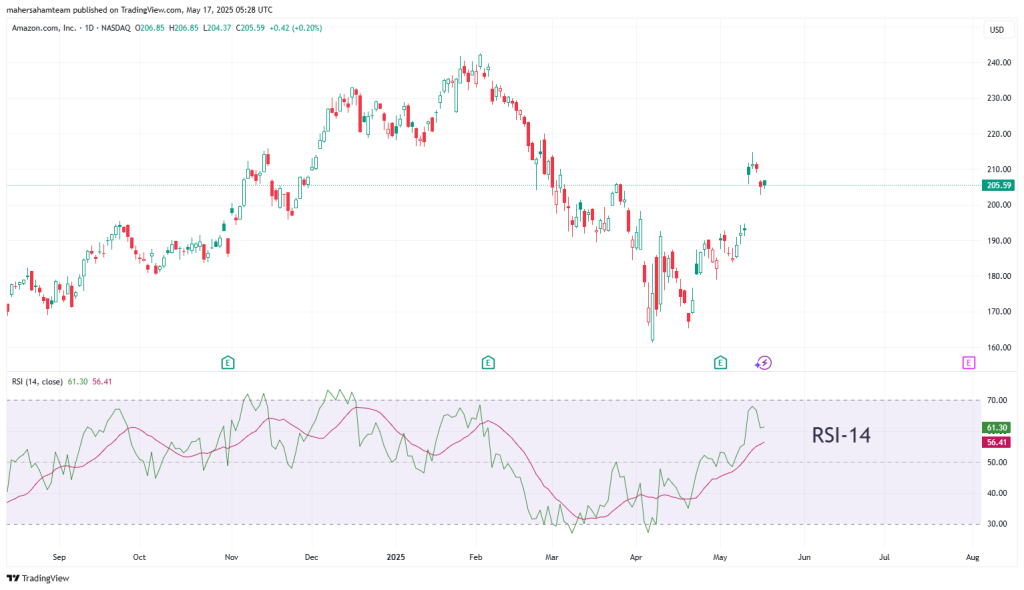
How Is It Used?
- RSI ranges from 0 to 100.
- A reading below 30: oversold (potentially time to buy).
- A reading above 70: overbought (potentially time to sell).
Key Signals:
- RSI rises above 30 = buy signal.
- RSI drops below 70 = sell signal.
- RSI around 50 = sideways market.
Advantages:
Ideal for timing market entries and exits, especially in trending markets.
3. MACD – Moving Average Convergence Divergence
What Is It For?
A combination of trend and momentum indicators. It helps identify the strength and direction of price movement.
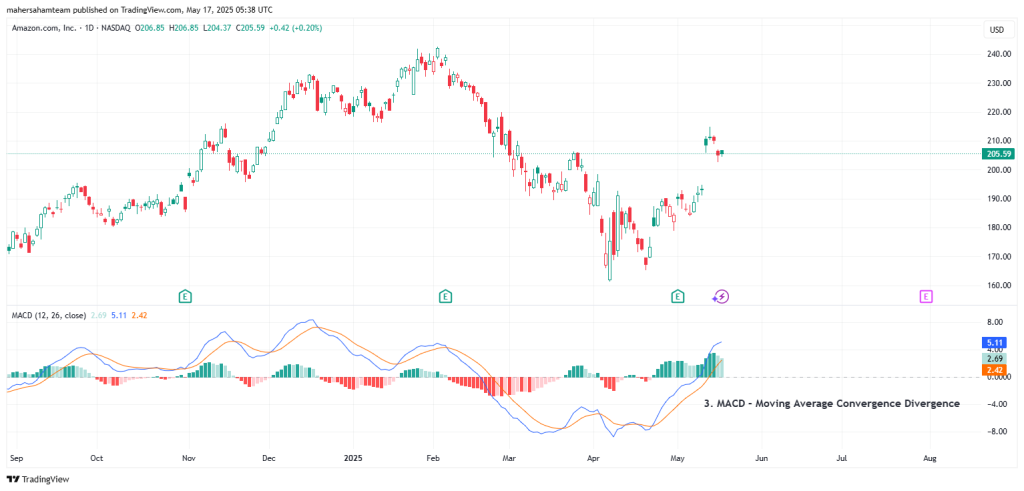
How Is It Used?
- Calculate the difference between the 12-day EMA and 26-day EMA = MACD Line.
- Add another line called the Signal Line (9-day EMA).
- When the MACD Line crosses above the Signal Line = buy signal.
- When it crosses below = sell signal.
Advantages:
Can detect potential early reversals through divergence.
Identifies trend direction and momentum more clearly.
4. Bollinger Bands
What Is It For?
Bollinger Bands measure volatility levels and help identify whether prices are relatively high or low compared to the average.
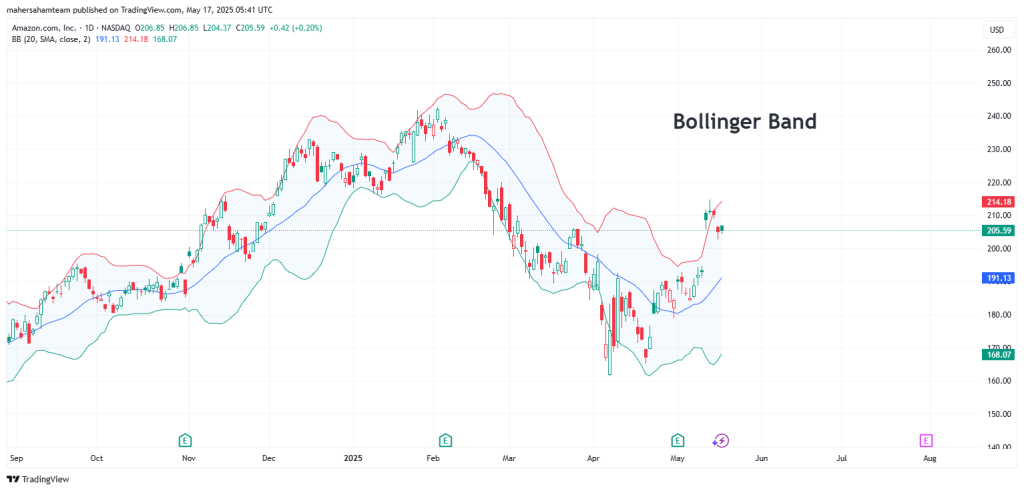
How Is It Used?
- Consists of 3 lines:
- Middle Band: 20-day SMA
- Upper & Lower Bands: 2 standard deviations from the average
- Price touching the Upper Band = strength
- Price touching the Lower Band = weakness
Key Signals:
- A breakout beyond the band = potentially the start of a strong trend.
- When price reverts towards the middle band = sign the market is stabilising.
Advantages:
Helps identify when the price has moved too far from the average.
Suitable for volatile markets.
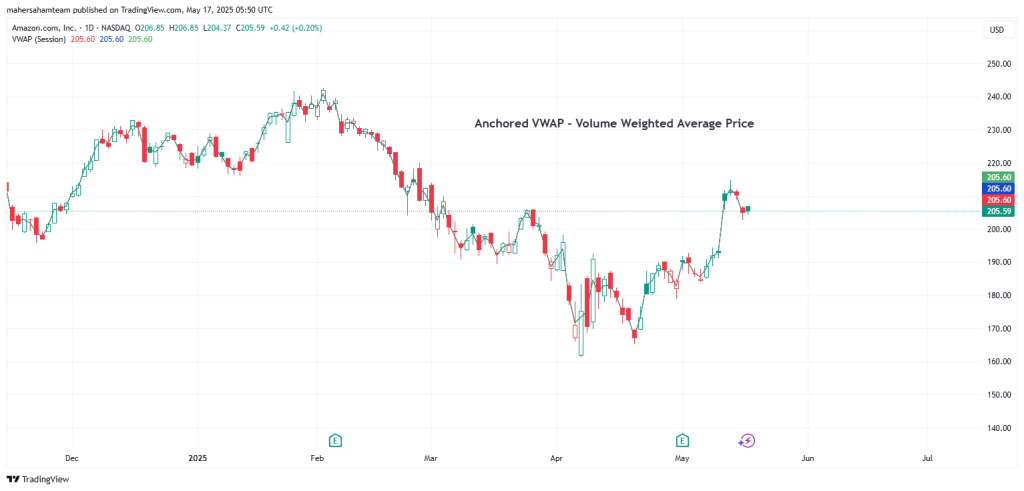
5. Anchored VWAP – Volume Weighted Average Price
What Is It For?
VWAP is the average price based on volume, but Anchored VWAP begins from a specific point in time, such as after an earnings announcement or a breakout.
How Is It Used?
- VWAP acts as a "fair price" based on volume since a specific point.
- It can serve as support/resistance zones.
Advantages:
- Extremely useful for intraday and swing traders.
- Shows key price levels where many investors have bought or sold.
Conclusion: Use It As a Tool, Not a Prediction
Technical indicators are not crystal balls. They cannot predict the future. But they are incredibly useful for structuring your strategy, managing risk, and making more objective decisions.
Combine several of these indicators with your trading plan for more consistent results. Do not rely too heavily on just one. What matters most is — discipline and patience.
Note: If you are new to trading, take the time to understand each of these indicators one by one. Use a demo account to test your understanding before committing real money.
Personal Coaching Class under the guidance of Tuan Maher Alias
"There is nothing wrong with stocks. But perhaps your strategy does not suit who you are."
Many investors lose money not because the stocks were bad — but because they do not understand their own investment personality.
In Mahersaham''s personal coaching, we help you:
![]() Identify your decision-making style, experience & past investment mistakes
Identify your decision-making style, experience & past investment mistakes
![]() Determine a strategy based on your capital, time & commitment
Determine a strategy based on your capital, time & commitment
![]() Use 11 elements & 29 criteria to produce a scoring system that filters only the best counters
Use 11 elements & 29 criteria to produce a scoring system that filters only the best counters
![]() Learn to choose the right screener & strategy, not follow blindly
Learn to choose the right screener & strategy, not follow blindly
![]() Guided by a certified expert with MSTA (UK) & CFTe (US) qualifications.
Guided by a certified expert with MSTA (UK) & CFTe (US) qualifications.
![]() This coaching is not for everyone. It is for those who are serious about building confidence & consistency in investing. Contact us: https://wa.link/dwyf1o
This coaching is not for everyone. It is for those who are serious about building confidence & consistency in investing. Contact us: https://wa.link/dwyf1o
FAQ — Frequently Asked Questions
What are the 5 most important technical indicators for beginner traders?
The five essential technical indicators are Moving Average (MA), Relative Strength Index (RSI), MACD (Moving Average Convergence Divergence), Bollinger Bands, and Volume. Each indicator provides different insights about trends, momentum, and market liquidity.
Is technical analysis alone sufficient to succeed in stock trading?
Technical analysis is a very useful tool but is best combined with fundamental analysis and sound risk management. Successful traders typically use a combination of both approaches along with a clear trading plan and strong discipline.
How long does it take to become proficient at reading stock charts?
On average, it takes about 6 months to a year of consistent practice to begin understanding stock charts well. The key is continuous practice using a demo account or small capital whilst systematically learning chart patterns and technical indicators.
What are common mistakes beginner traders make in technical analysis?
Common mistakes include using too many indicators simultaneously, ignoring the main market trend, not setting stop losses, and making decisions based on emotions without referring to charts. Successful traders typically focus on just a few indicators and remain disciplined.
Reading stock charts correctly is a skill that can be learnt and honed. With the right knowledge of technical indicators, you can increase your probability of success in stock trading.
Open your CDS account today through our step-by-step guide here to start investing in the stock market.
Download the free stock basics ebook to learn the fundamentals of stock investing from scratch.