Multiple Timeframe and Index Analysis: How to Read the Market Top-Down

Many traders in Malaysia open a chart, zoom straight into one stock on one timeframe - and start making decisions. They see a beautiful setup on the 15-minute chart, hit buy, and are shocked when the price drops 3% within an hour. What did they miss? They never checked the "weather" before setting sail. They did not know the index was falling, the sector was weak, and the weekly trend was actually heading down.
This is where the combination of multiple timeframe analysis and index analysis becomes the weapon that separates consistent traders from those who constantly feel the "market makes no sense". Imagine standing on a hilltop, surveying the entire landscape first, before descending and choosing which path to take. That is the concept of top-down analysis - you read the market from the top down, not from the bottom up.
In this article, we will break down practically how the combination of these two techniques works, what timeframe combinations are most effective, a step-by-step guide to performing top-down analysis, and common mistakes to avoid. Everything is tailored for investors and traders on Bursa Malaysia.
What Is Multiple Timeframe Analysis?
Multiple timeframe analysis is a technique of analysing the same asset - a stock, index, or any instrument - across two to three timeframes simultaneously. For example, you view the weekly chart to understand the major trend direction, the daily chart to identify setups, and the 4-hour (4H) chart to find precise entry points.
The logic is simple. The higher timeframe tells you "what" - is the market going up, down, or sideways? This is your compass. You do not want to swim against a strong current. The lower timeframe tells you "when" - at what price and at what time should you act? This is your timing.
According to research published by Tradeciety, traders who consistently use multiple timeframe analysis achieve win rates between 60-75%, compared to around 45% for those who rely on a single timeframe. This difference is significant because when you trade in the direction of the higher timeframe trend, your probability of success increases naturally.
Many new traders enter positions based on signals on the 15-minute chart without checking what is happening on the daily chart. As a result, they frequently get trapped in counter-trend moves that look attractive on the lower timeframe but are actually just minor pullbacks within a larger downtrend. If you typically trade intraday, we have a dedicated guide on multi-timeframe analysis for intraday trading using 4H, 1H and 15-minute charts that you can use as additional reference.
What Is Index Analysis?
Index analysis is a method of using market indices as indicators of the overall health and direction of the stock market. Think of an index like the market's "body temperature" - when the index rises, most stocks tend to rise as well; when the index falls, most stocks come under pressure too.
On Bursa Malaysia, the primary index is the FBMKLCI (FTSE Bursa Malaysia Kuala Lumpur Composite Index), which comprises the 30 largest companies by market capitalisation. Besides the KLCI, there are other useful indices for broader context: FBMEMAS (covering mid and large-cap stocks), FBM70 (the 70 largest stocks after the 30 in KLCI), FBM Small Cap (small-cap stocks), as well as sectoral indices such as FBM Technology, FBM Plantation and FBM Finance.
For global context, Malaysian traders also need to monitor international indices such as the S&P 500 (500 largest US companies), Dow Jones Industrial Average (30 US blue-chip companies), and Nasdaq Composite (heavily weighted towards the technology sector). Global markets are interconnected - a Wall Street decline overnight is often translated into a red opening on Bursa the next morning.
Why does this matter? An old investment adage goes: "a rising tide lifts all boats". In a bull market, nearly all stocks tend to rise even though not all rise at the same rate. Conversely, in a bear market, even the best stocks struggle to fight the overall current. If you want to understand market sentiment more deeply before selecting individual stocks, our article on mastering global sentiment and stock technicals can provide you with a comprehensive framework.
Top-Down Analysis: Combining Both Techniques
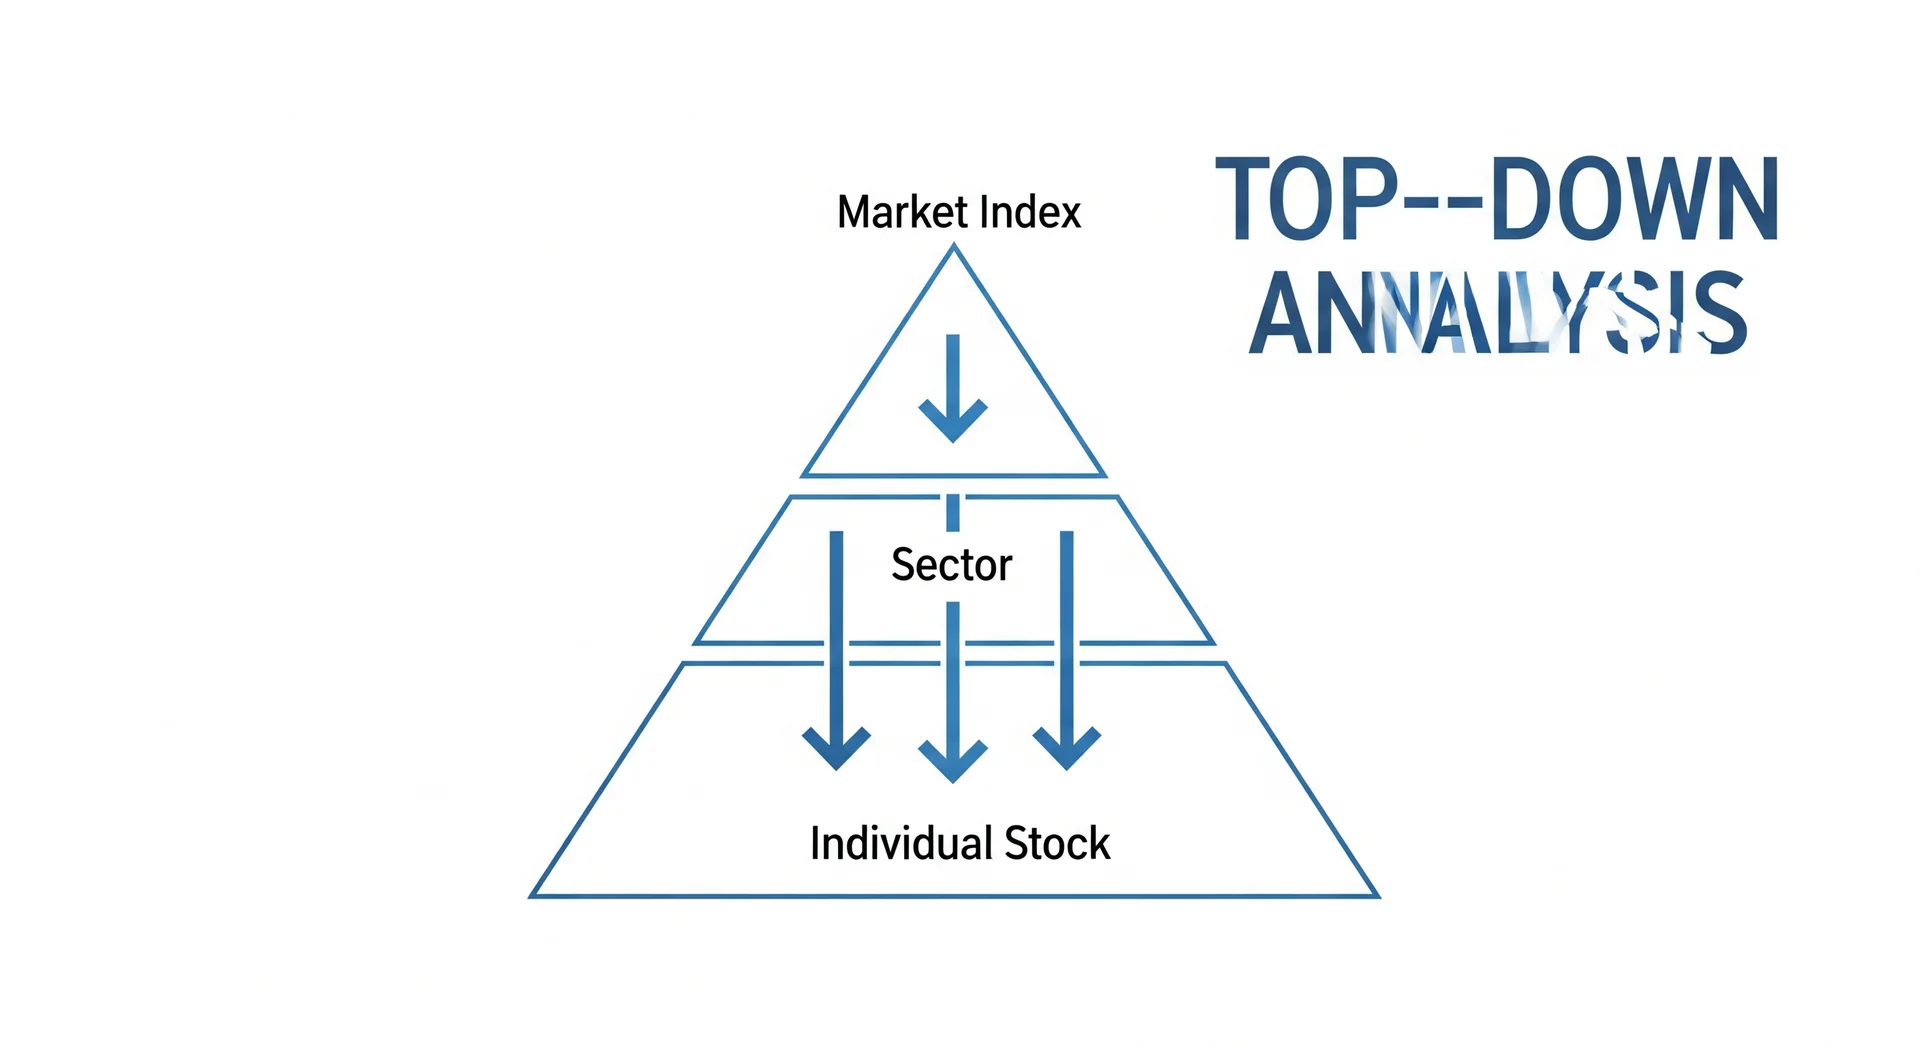
Top-down analysis is a systematic approach that combines index analysis and multiple timeframe analysis into one coherent framework. The concept: you start from the broadest picture, then narrow down progressively until you arrive at a specific trading decision.
The logical flow goes like this: Index (overall market) then Sector (industry group) then Individual Stock. At each level, you use appropriate timeframes to assess the direction and strength of the trend. According to a guide published by NinjaTrader, this approach functions as a three-layer filter - market direction at the first layer, sector strength at the second layer, and individual stock setup at the third layer. Each layer filters out lower-quality opportunities.
The problem with most retail traders is that they do it in reverse. They start by choosing a stock - perhaps because they heard a "tip" on Telegram or saw a penny stock pumped 20% - then look for technical justification afterwards. They never check whether the index is supportive, whether the relevant sector is strong, or whether the larger trend is on their side. This bottom-up approach is like choosing a restaurant without knowing the entire area is flooded.
With top-down analysis, you ensure every trading decision is supported by broader context. If the KLCI is in a downtrend, you know that most stocks will be under pressure - so you either reduce exposure, look for shorting opportunities, or wait on the sidelines. If the technology sector is outperforming other sectors, you focus on finding setups only within technology counters. This filter saves time and significantly reduces your risk.
3 Effective Timeframe Combinations
Not all timeframes suit every type of trader. According to a guide by Rayner Teo from TradingWithRayner, the basic rule is that each timeframe should be approximately 4 to 6 times smaller than the timeframe above it. This ensures each layer provides a sufficiently different perspective without too much overlap.
Here are three of the most effective combinations based on your trading style:
1. Swing Trader: Weekly - Daily - 4H
This is suitable if you hold positions for several days to several weeks. The weekly chart determines the main trend direction - is the stock in an uptrend, downtrend or sideways? The daily chart is used to identify setups such as pullbacks to moving averages, breakouts from consolidation, or candlestick pattern formations. The 4-hour chart is used to fine-tune your entry - finding the precise entry point so your stop loss can be tighter.
2. Active Trader: Daily - 4H - 1H
Suitable for traders who actively monitor the market and make decisions within a timeframe of several days. The daily chart serves as the main trend compass, the 4H chart for setups and patterns, and the 1-hour chart for more precise entry and exit timing. This combination is popular among Bursa Malaysia traders who trade full-time but do not want to focus too much on short-term noise.
3. Day Trader: 4H - 1H - 15min
For traders who enter and exit positions within the same day. The 4H chart provides intraday trend context, the 1-hour chart identifies support-resistance zones and setups, and the 15-minute chart provides sharp entry and exit timing. We have a comprehensive guide for this combination in our article on intraday trading multi-timeframe analysis using 4H, 1H and 15-minute charts.
The key rule: do not mix more than three timeframes. Three is sufficient to provide a complete picture. More than that will only confuse you and make you see conflicting signals everywhere.
Step by Step: The Top-Down Multiple Timeframe Method
Now we get to the most practical section. Here are six steps you can follow every time before making a trading decision.
Step 1: Check the Index Direction on the Higher Timeframe
Open the FBMKLCI chart on the weekly or monthly timeframe. Ask yourself: is the index in an uptrend, downtrend, or sideways? Observe the price position relative to key moving averages such as the 50 MA and 200 MA. If the KLCI is above the 200 MA and making higher highs and higher lows, the market environment is bullish. This means the probability for long positions is higher.
For global context, also check the S&P 500 and Nasdaq. If the US market is strong, this positive sentiment typically spreads to Asian markets including Bursa Malaysia.
Step 2: Identify the Strong Sector
After knowing the overall market direction, check which sector is outperforming the market. This is called sector rotation - at any given time, some sectors lead while others lag. For example, in a low interest rate environment, the real estate and construction sectors are typically strong. In a rising commodity environment, the plantation and oil sectors usually lead.
Use Bursa Malaysia's sectoral indices - FBM Technology, FBM Plantation, FBM Finance - to compare relative strength between sectors. The sector that is strongest on the higher timeframe is the best "pond" for you to fish in.
Step 3: Screen Individual Stocks Within That Sector
Now you focus on individual stocks, but only within the sector identified as strong. Look for stocks showing upward momentum - increasing volume, price above moving averages, or fresh breakouts from consolidation. This sector filter automatically reduces a list of hundreds of stocks to perhaps only 20-30 counters worthy of further study.
Step 4: Analyse the Stock on the Middle Timeframe - Find the Setup
Open the screened stock's chart on your middle timeframe (Daily or 4H, depending on your chosen combination). At this stage, you are looking for specific trading setups: pullbacks to support, breakouts from resistance, pattern formations such as ascending triangles, bull flags, or signals from the indicators you use. Ensure this setup is aligned with the trend on the higher timeframe identified in Step 1.
Step 5: Drop to the Lower Timeframe for Entry Timing
Once a setup is found, move down to the smallest timeframe in your combination (1H or 15 minutes) to determine the precise entry point. The goal is to get an optimal entry so your stop loss can be placed as close as possible to the invalidation level. For example, if on the daily chart you see the price pulling back to the 50 MA, drop to the 1-hour chart to look for a reversal candlestick or a higher low formation as confirmation before entering.
Step 6: Set Stop Loss and Target Based on the Setup Timeframe
Stop loss and profit targets should be based on the middle timeframe (where you spotted the setup), not the lower timeframe. This is because the lower timeframe is too sensitive and stop losses based on it will be too tight - you will get "stopped out" before the trade has a chance to work. Place your stop loss below the nearest support level or swing low on the middle timeframe, and your target at the next resistance level or swing high.
How to Read the FBMKLCI for Trading Guidance
The FBMKLCI is the primary reference for Bursa Malaysia traders. Here is how to read it as a trading guide:
KLCI above 200 MA = Bullish environment. When the index is above the 200-day moving average, this signals that the long-term market trend is upward. In this environment, your primary strategy should lean towards long positions. Stocks that pull back to support within an uptrend become attractive entry opportunities.
KLCI below 200 MA = Caution, reduce exposure. When the index falls below the 200 MA, this is a signal that the major trend may have shifted to bearish. It does not mean you need to sell all holdings immediately, but you should reduce position sizes, tighten stop losses, and be more selective in choosing stocks.
KLCI in consolidation = Range-bound, trade individual setups. When the KLCI moves sideways within a certain range for several weeks or months, this means there is no clear direction for the overall market. In this situation, individual stocks become more important than the index - focus on counters with strong technical setups regardless of market direction.
Breadth indicator: how many stocks are rising vs falling. Besides the index price itself, also observe market breadth - the ratio of advancing stocks to declining stocks on any given day. If the KLCI rises but more stocks are falling than rising, this indicates the rally is supported by only a few heavyweight counters and may not be sustainable. Conversely, when most stocks rise alongside the index, the rally is "healthier" and more reliable. To understand which indicators work best alongside this analysis, refer to our guide on the best trading indicators for beginners.
5 Common Mistakes in Multiple Timeframe Analysis
Although this concept appears straightforward, many traders still stumble. Here are the five most common mistakes:
1. Looking at too many timeframes simultaneously
Some traders open five or six charts - monthly, weekly, daily, 4H, 1H and 15-minute - all at once. The result is not clarity but confusion. Each timeframe shows different signals, and your brain cannot process all of them coherently. Two to three timeframes is sufficient. More than that only adds noise without adding value.
2. Trading counter-trend on the higher timeframe
This is the most expensive mistake. You see a beautiful buy setup on the 1-hour chart, but on the daily chart the stock is in a clear downtrend. You enter long, and the setup fails because selling pressure from the higher timeframe is far more powerful. The rule is simple: do not fight the higher timeframe trend. If the daily chart shows a downtrend, do not buy based on signals on the 15-minute chart.
3. Ignoring the index and overall market conditions
Some traders are so focused on individual stocks that they never check what is happening with the FBMKLCI, S&P 500, or global markets. They buy the best stock in the world and still lose money because the entire market is falling. Always start your analysis from the index - if the market is plunging, the chances of an individual stock sustaining an uptrend are very low.
4. Switching timeframes to justify a losing position
This is another psychological trap. You enter a trade based on a setup on the 4-hour chart. The price starts moving against you. Instead of admitting the trade was wrong and exiting, you switch to the daily chart and say "oh, on the daily it still looks fine". Then when the daily also starts showing bad signals, you switch to the weekly. This is not analysis - this is denial. Your setup timeframe is the timeframe on which you should evaluate whether the trade is still valid or not.
5. Not placing stop loss according to the setup timeframe
Your stop loss must be based on the timeframe where you spotted the setup, not a higher or lower timeframe. If your setup is on the daily chart, your stop loss goes below the swing low on the daily chart. Do not place it based on the 15-minute chart (too tight, easily stopped out) or the weekly chart (too far, excessive risk). Setup timeframe = stop loss timeframe.
Frequently Asked Questions (FAQ)
1. How many timeframes should I use?
Two to three timeframes is sufficient. The first timeframe for trend direction, the second for setups, and the third (if needed) for entry timing. More than three will create confusion.
2. What happens if the higher and lower timeframes give conflicting signals?
Always follow the higher timeframe. If the higher timeframe shows a downtrend and the lower timeframe shows a buy setup, ignore that setup. The higher timeframe is the "boss" - it determines the direction while the lower timeframe only determines timing.
3. Do I need to check the index every day?
Yes, at least at the start of the trading session. A quick check of the FBMKLCI and S&P 500 takes less than 5 minutes and gives you valuable context about that day's market environment. You do not need an in-depth analysis every day - just knowing the trend direction and the position relative to key moving averages is enough.
4. Is the top-down method suitable for long-term investors?
Yes, but with adjustments. Long-term investors can use monthly and weekly timeframes to determine market direction, then the daily chart for purchase timing. The core concept remains the same - ensure you are buying in a supportive environment, not fighting the major trend.
5. Which index is most important for Bursa Malaysia traders?
The FBMKLCI is the primary index. However, depending on the stocks you trade, sectoral indices may be more relevant. If you trade technology stocks, the FBM Technology Index may be more useful than the KLCI. For global context, the S&P 500 remains the most important reference.
6. Can I use this method for penny stocks or small-cap counters?
You can, but with caution. Small-cap counters often move based on internal factors (company news, stock manipulation) and are less influenced by the index direction. Top-down analysis is most effective for stocks with good liquidity that have a high correlation with overall market movements.
7. What is the difference between top-down and bottom-up analysis?
Top-down starts from the overall market (index) then narrows down to sectors and individual stocks. Bottom-up starts from individual stocks first - seeking stocks that are attractive fundamentally or technically regardless of market conditions. Both have their strengths, but top-down is more effective for timing and risk management.
8. How long does it take to perform a complete top-down analysis?
Once you are experienced, the entire process - from checking the index to identifying an entry on an individual stock - can be done in 15 to 30 minutes. At the beginning, it may take longer as you are still finding your comfortable flow. But with practice, it will become an efficient daily routine.
Conclusion
Multiple timeframe analysis and index analysis are not fancy techniques reserved for professional traders alone - they are a fundamental framework that every investor and trader should practise. By reading the market from the top down, you ensure every trading decision is supported by broader context, reduce the risk of fighting the current, and systematically increase your probability of success.
Start with the simplest step: before buying any stock tomorrow, check the FBMKLCI first. That alone already puts you ahead of most retail traders who only see the trees but miss the forest.
By understanding how to read the market from the perspective of indices and multiple timeframes, the next step is having access to the market to put this knowledge into practice.
Open your CDS trading account to start investing on Bursa Malaysia as well as international markets such as the US and Hong Kong.
You can also download our free stock market basics ebook to build a solid foundation before you begin trading.