Using Pine Script in TradingView - Part 3
Greetings and hello. Hope you are doing well. As you may know, I have previously published articles on using Pine Script in Part 1 and Part 2.
Do read those articles first to get an overview of Pine Script usage.
Today we will continue our Pine Script learning with Part 3.
Ready? Let us prepare a clear mind to learn together.
Pine Script Study
Pine Script Study is slightly different from Pine Script Strategy.
The Study function is primarily used for conducting research on a particular counter by adding indicators, symbols, or reminders.
Pine Script Strategy, on the other hand, is used for backtesting your existing strategies.
For example, we create a strategy to detect the momentum of a particular counter.
Then we will backtest using the data or historical records that TradingView has.
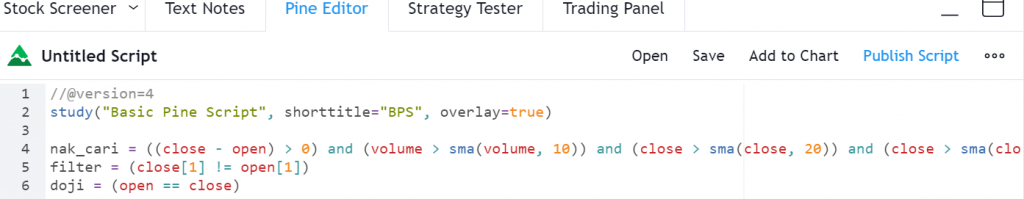
Version & Study Pine Script
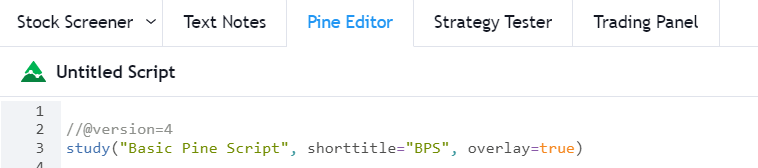
As you can see in the image above, in Pine Script Part 3 you need to use version=4, which is the latest version in Pine Script.
And use study instead of strategy. For study, enter "Basic Pine Script" and shorttitle "BPS".
The shorttitle BPS is important as it will appear on your TradingView chart. If you use a long name, it might cover your indicators or chart.
Next is overlay=true.
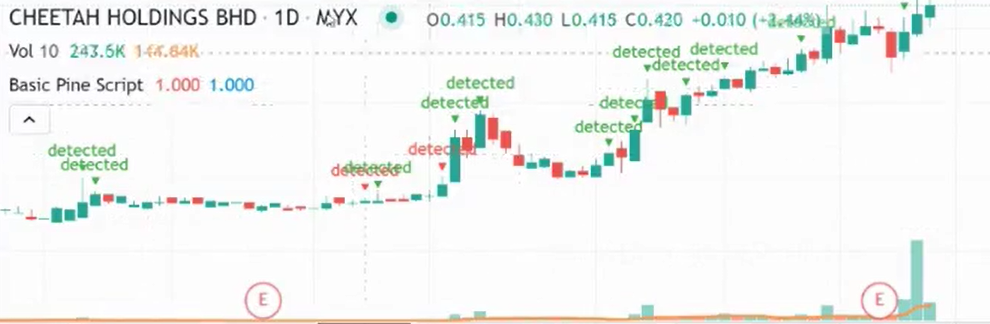
Using overlay=true, the word detected will appear above the chart/candlestick.
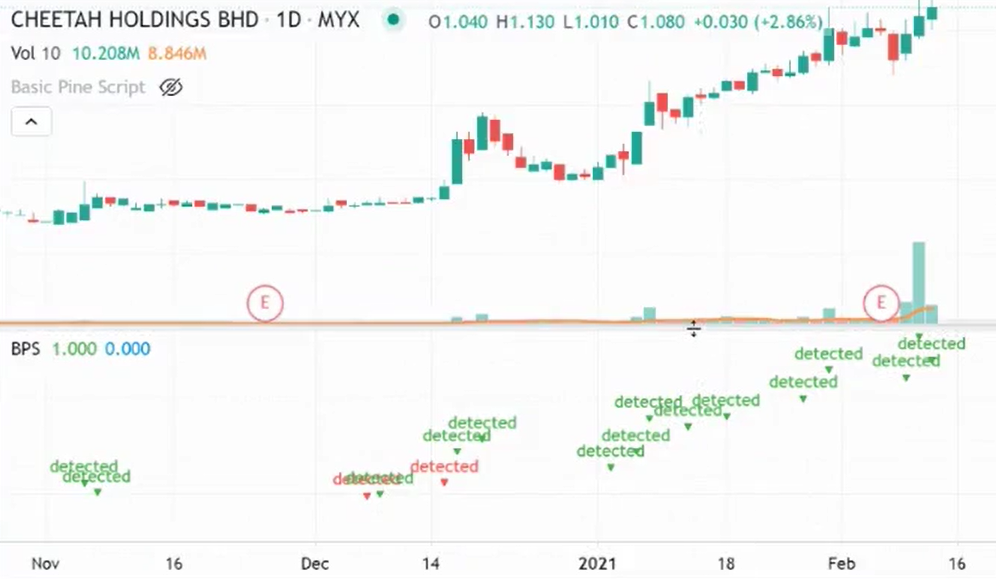
However, if you set overlay=false, the text will appear below instead of above the candlestick.
It will produce another layout as shown in the image below.
So choose overlay=true
Variable
Look at the image above. The nak_cari (search criteria) is the variable that defines what you want to find.
Here I have set nak_cari to check if the close price (today''s stock price) minus the open price results in a value greater than zero.
This means the candlestick is green (bullish).
Alternatively, you can use close > open = green candlestick.
Conditions
Among the conditions you need to set in this Pine Script are:
- Green candlestick
- Today''s volume is greater than the average volume of the past 10 days
- Today''s close price is higher than the average price of the past 20 days
Volume: Today''s volume must be greater than the average volume of the past 10 days. So we use SMA for the past 10 days.
Basically, we use Simple Moving Average (20, 50 & 200).
Filter : filter = (close[1] != open[1])
For the filter, I set close(1), which means yesterday''s closing price.
The exclamation mark symbol means not equal to.
So we are looking for where yesterday''s close price does not equal yesterday''s open price. This candlestick pattern refers to a Doji formation.
On that particular day, trading volume may have been minimal.
Function & Condition
Next is the function. Functions make it easier for you to obtain values based on the conditions we set.
fnc(x, y) =>
if ( x and y)
true
I set x and y to obtain a true result.
Both must be true.
Pine Script Results
The parameters I will set are nak_cari, filter.
result = fnc(nak_cari, filter)
The result will return true if both x and y are true.
Plotshape
Finally, in Pine Script Part 3, we will create a plotshape. Plotshape will plot whatever shape we want on the chart.
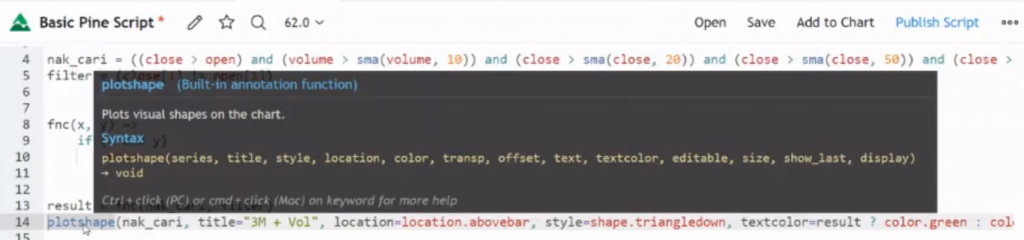
As you can see in the image above, there are many elements in the plotshape function.
These include series, title, style, location, colour, transp, offset, textcolour, editable, size, show last & display.
Below is the script you can follow:
plotshape(nak_cari, title="3M + Vol" -- for the title, keep it simple and sweet
location=location.abovebar -- the word "detected" will appear above the bar chart
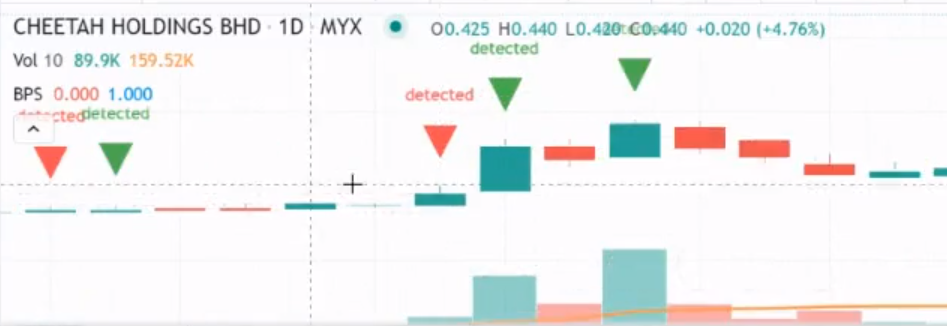
style=shape.triangledown -- will produce a downward triangle shape as shown in the image above.
textcolor=result ? color.green : color.red -- produces green and red candlesticks. If the result is true, the candlestick will be green and vice versa.
text="detected" -- the word "detected" appears above the triangle. You can also change it to another word.
size=size.auto -- so it does not cover other features.
Done! Lastly, save and add to chart. Your Pine Script Part 3 is now complete.
Conclusion
In conclusion, you can use Pine Script to simplify your stock analysis. It is straightforward -- if you do not understand something, just keep revising.
Below I have provided the complete script so you can follow along:
//@version=4
study("Basic Pine Script", shorttitle="BPS", overlay=true)
nak_cari = ((close - open) > 0) and (volume > sma(volume, 10)) and (close > sma(close, 20)) and (close > sma(close, 50)) and (close > sma(close, 200))
filter = (close[1] != open[1])
doji = (open == close)
fnc(x, y) =>
if ( x and y)
true
result = fnc(nak_cari, filter)
plotshape(nak_cari, title="3M + Vol", location=location.abovebar, style=shape.triangledown, textcolor=result ? color.green : color.red, text="detected", size=size.auto, color=result ? color.green : color.red)
plotshape(doji, title="Doji", location=location.belowbar, style=shape.triangleup, textcolor=color.blue, text="doji", size=size.auto, color=color.blue)
Watch the video below for a better understanding of this lesson.
Hope this is beneficial!
Frequently Asked Questions (FAQ)
1. What is Pine Script in TradingView?
Pine Script is TradingView''s proprietary programming language that allows you to write scripts to create custom indicators, automated trading strategies, and alerts based on specific criteria.
2. Can Pine Script automatically detect candlestick patterns?
Yes, Pine Script can be coded to detect various candlestick patterns such as Doji, Hammer, Engulfing, and others automatically, displaying signals directly on the chart.
3. Do I need coding knowledge to use Pine Script?
Basic coding knowledge helps, but TradingView provides comprehensive documentation and sample scripts. You can start by copying and modifying existing scripts according to your needs.
4. What are the advantages of using Pine Script compared to standard indicators?
Pine Script allows you to customise indicators according to your personal strategy, combine multiple conditions in a single script, and create more specific automated alerts for your trading.
Ready to start investing in stocks? Open a CDS account with Mahersaham today. Download the free stock basics ebook for a complete guide!