Popular Candlestick Patterns & How to Find Them on TradingView
Hello and welcome! How are you doing? Hope you are well. In this article, I will share with you all about popular candlestick patterns on TradingView.
You can read our article on the basics of candlesticks first for a deeper understanding of candlestick fundamentals.
Previously, Mahersaham shared articles about the basics of candlestick formation and types of bullish candlesticks to give you foundational knowledge on candlestick analysis.
Once you have learnt the basics of candlesticks, let us move on to learn about popular candlestick patterns on TradingView.
Before we head over to TradingView, let us recap the types of bullish candlestick patterns.
For this article, we will focus on bullish candlestick patterns.
Types of Candlestick Patterns
- Bullish Engulfing
The first candlestick pattern is Bullish Engulfing.
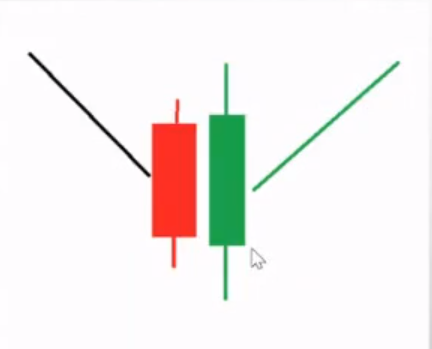
A Bullish Engulfing occurs when there is a downtrend, and then you find a large candle that engulfs the previous candle.
This means the green candle completely covers the red candle.
This indicates that the market is about to change direction from a downtrend to an uptrend, signalling a reversal.
2. Morning Star
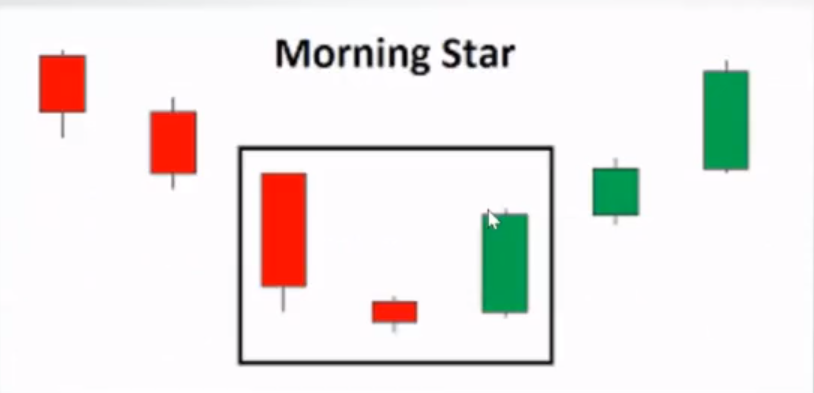
The second pattern is the Morning Star.
The concept is similar to the Bullish Engulfing. If there was a downtrend before, it will transition into an uptrend.
When you find 3 candles arranged as shown in the image above, it means the price will reverse upward into an uptrend.
3. Bullish Harami
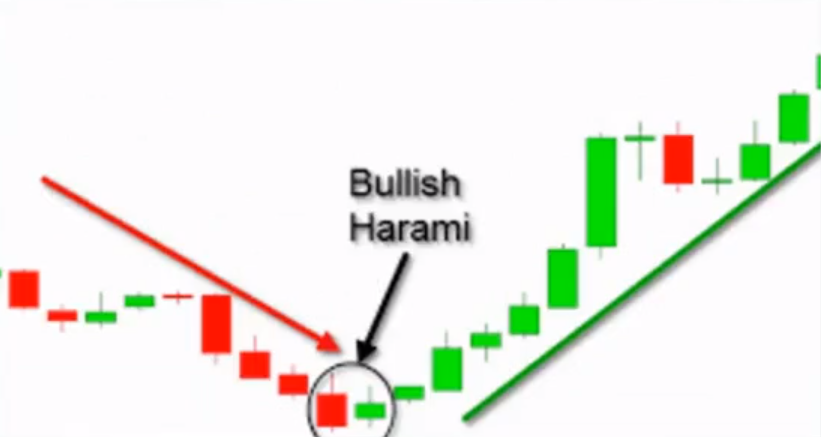
The third candle pattern is the Bullish Harami.
What does harami mean?
Harami in Japanese means pregnant woman.
If you look at the candlestick, it resembles a body with a slightly protruding belly.
For the harami pattern, the concept is the same — when there is a downtrend and you find 2 candlesticks as shown above, it will shift to form an uptrend.
4. Hammer
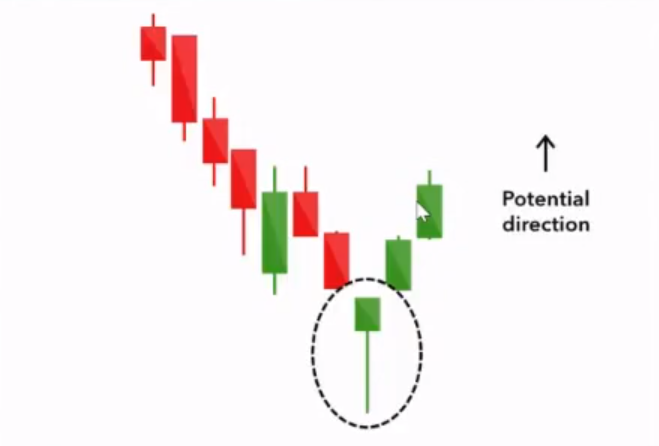
The last pattern is the Hammer candlestick.
The Hammer candlestick is the most famous because it is the easiest to spot.
When there is a downtrend and you find a candlestick shaped like a hammer, it will change to an uptrend.
How to Find Candlestick Patterns on TradingView
Alright, we have completed the first stage.
As you know, there are far too many counters listed on Bursa Malaysia.
So it can be quite difficult for those who have learnt candlestick patterns to find these patterns across individual counters on Bursa Malaysia.
Let me help make it easier for you to find which counters are showing candlestick signals.
First, open your TradingView.
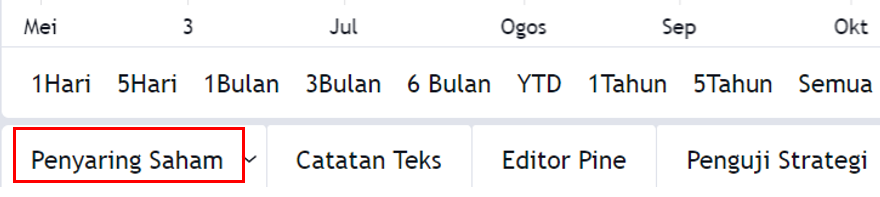
Then go to the bottom-left corner. Click on the stock screener as shown in the image below.
Once you click on the stock screener, you will see a screen like the image below.
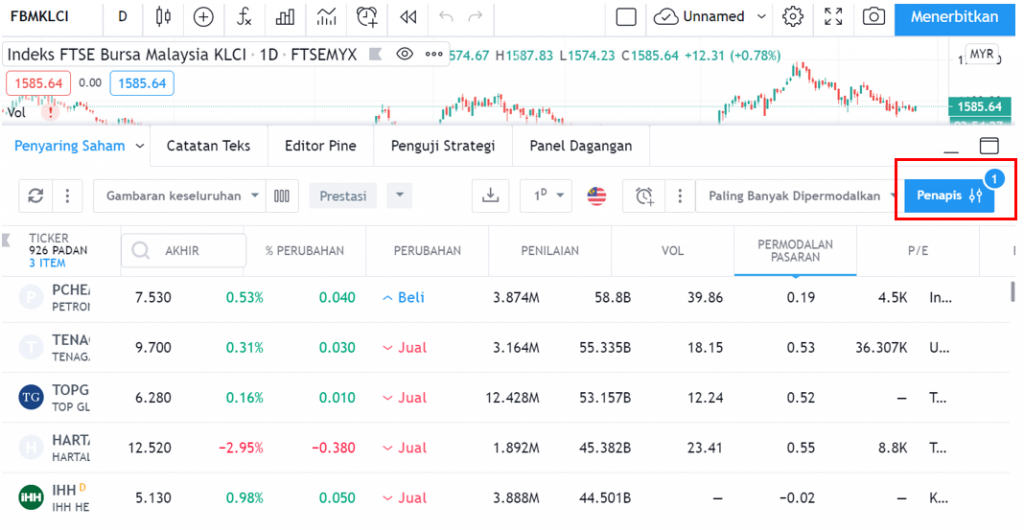
The question is, how do you find which counters have a bullish engulfing signal?
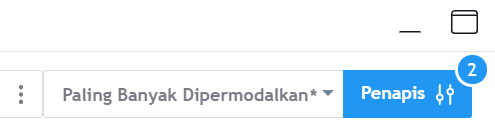
Click on the filter button.
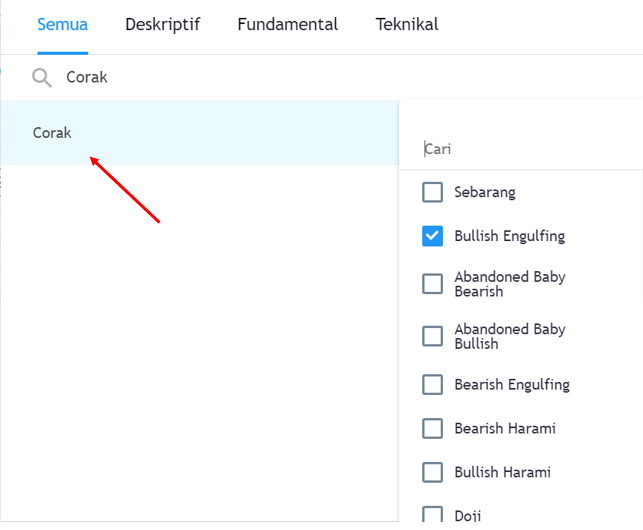
After clicking on the filter, you will see a screen like the image above.
Search for pattern in the filter search bar and you can select bullish engulfing or any other pattern you want to analyse.
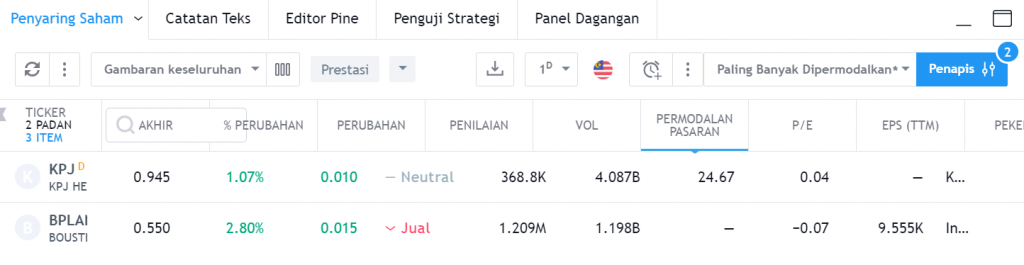
Once you have selected the bullish engulfing candle, it will display the company names/counters that show a bullish engulfing signal.
As you can see, companies KPJ and BPLAI for today have the bullish engulfing candlestick pattern.
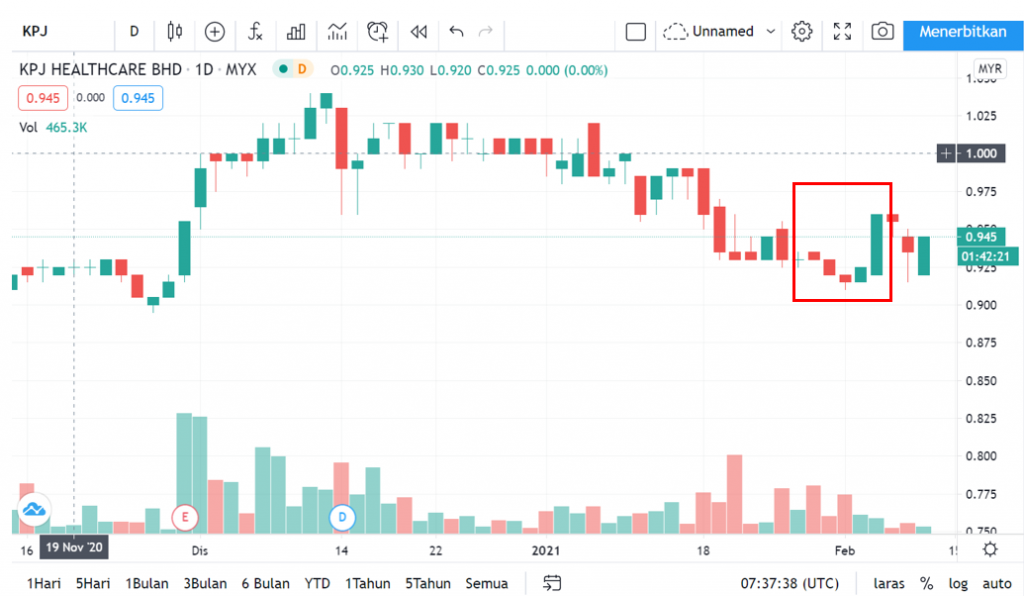
The image above shows a bullish engulfing pattern.
The first red candle followed by a second green candle that engulfs the previous candle.
Engulfing means its body''s close and open are larger than the close and open of the previous candle.
However, for a bullish engulfing candle to be more significant and stronger, it should gap down first where the open is lower and the close is higher.
Shortcut
To make your work easier, click on the section next to the filter and search for save screen as.
Here you can save the candlestick that you are interested in analysing, for example the hammer candlestick.
So next time you do not need to search for the hammer candle again. You just need to click save screen as hammer.
And it will display the counters/companies that show a hammer candle signal.
TradingView Is an Essential Tool for Technical Analysis
This article is one of a series written under Technical Analysis: TradingView. Technical analysis is one of the key branches of stock market research.
There are many more topics covered in the technical analysis learning series and how you can use TradingView optimally to help you conduct research on stocks.
To view other topics related to TradingView or Technical Analysis, head over to the Complete Guide to Technical Analysis.
FAQ - Candlestick Patterns on TradingView
1. What is a candlestick pattern in stock analysis?
A candlestick pattern is a formation on a stock price chart based on the open, close, high and low prices. It helps traders predict the next direction of price movement, whether upward or downward.
2. How do you find candlestick patterns automatically on TradingView?
On TradingView, use the Screener function or Pine Script to detect candlestick patterns automatically. You can also use specialised indicators that mark patterns such as Doji, Hammer and Engulfing on the chart.
3. What are the most popular candlestick patterns for traders?
Among the most popular patterns are Doji, Hammer, Engulfing, Morning Star and Evening Star. Each pattern gives a different signal, either bullish or bearish, depending on its position on the chart.
4. Should you rely entirely on candlestick patterns?
No, candlestick patterns should ideally be used together with other indicators such as volume, moving average or support and resistance for stronger signal confirmation before making a trading decision.
Ready to start investing in stocks? Open a CDS account with Mahersaham today. Download our free stock basics ebook for a complete guide!