Reversal Chart Pattern: Complete Guide for Stock Traders
Today we will learn about chart patterns -- specifically, reversal chart patterns that every stock trader should know.
Chart Pattern
There are 3 types of chart patterns that exist:
- Reversal
- Continuation
- Bilateral
Today, we will focus on the reversal chart pattern.
What is a Reversal Chart Pattern?
A reversal chart pattern signals a change in the stock price trend -- from an uptrend to a downtrend, or vice versa.
How does it occur?
When you spot a particular pattern on the chart during technical analysis, there is a possibility that a reversal will occur in the price movement trend.
For example, a stock may have been in a downtrend, and then a chart pattern forms. From there, we can expect the downtrend may reverse into an uptrend. This is called a reversal situation.
Conversely, a stock may have been in an uptrend. Then a pattern appears, and it reverses into a downtrend.
As traders, we must be skilled at identifying chart patterns on the chart. Chart patterns serve as early indicators of whether a stock price will trend upward or downward.
One important thing to remember is that a chart pattern is only confirmed after a breakout occurs.
Until a breakout happens, the chart pattern is not yet confirmed.
Once you have drawn a chart pattern and a breakout has occurred, you can actually measure your target price.
How? Let us look at the examples below.
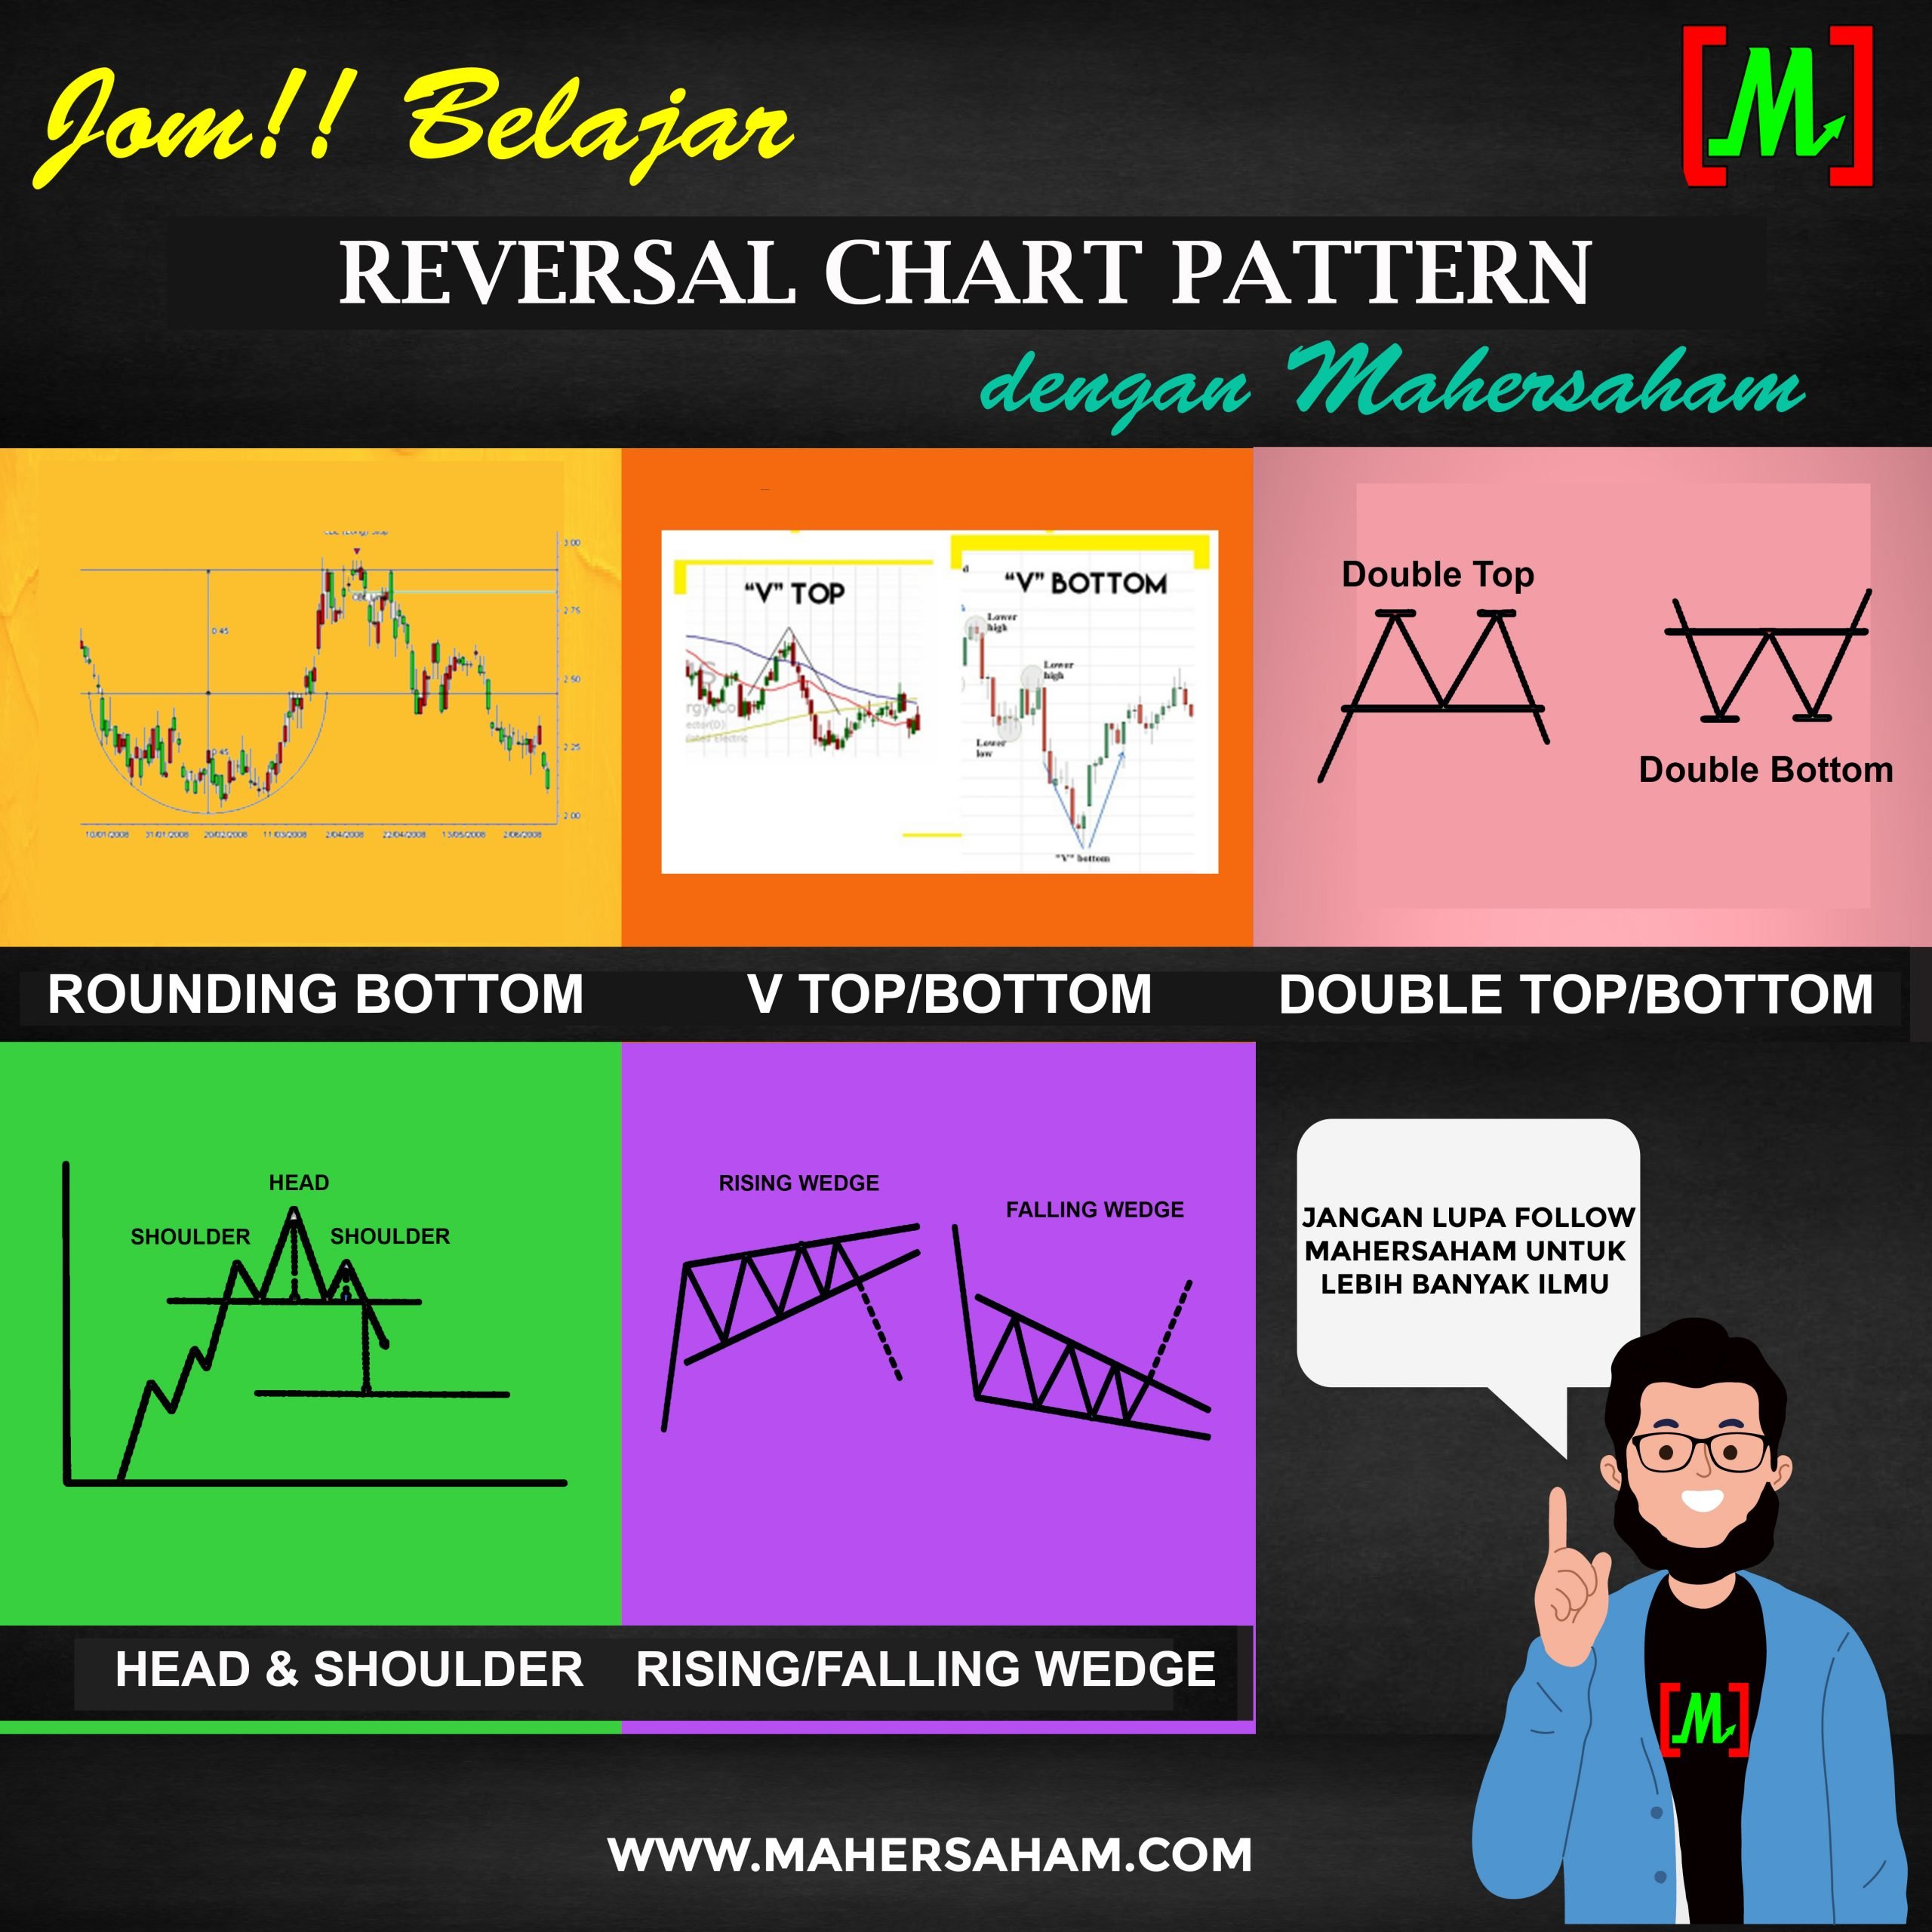
Major Reversal Chart Patterns
There are two types of reversal chart patterns: bullish and bearish.
1. Bullish Chart Patterns
Once a bullish chart pattern completes, the stock price is expected to rise. This is commonly referred to as a breakout.
Examples of bullish chart patterns include:
- Saucer / Rounding Bottom
- Inverted Head and Shoulder
- Double Bottom
- Triple Bottom
- V Bottom
- Falling Wedge
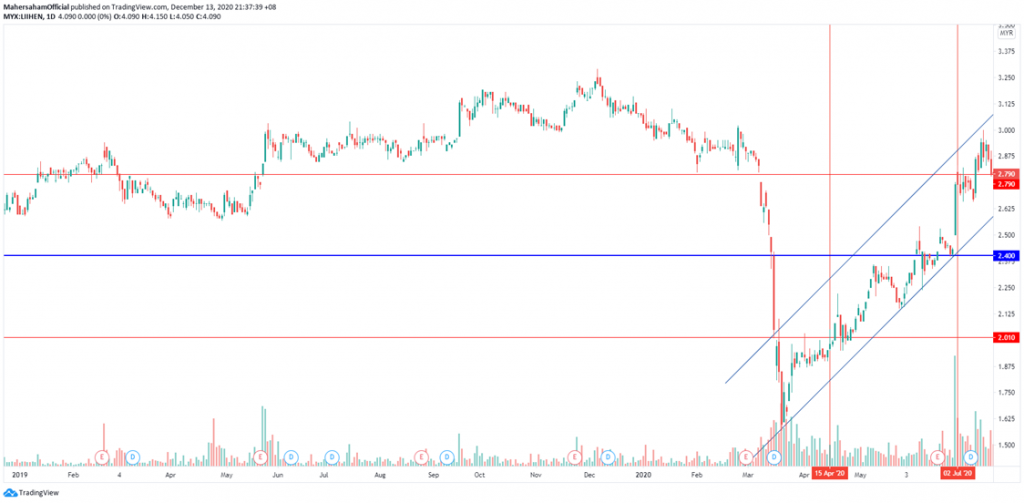
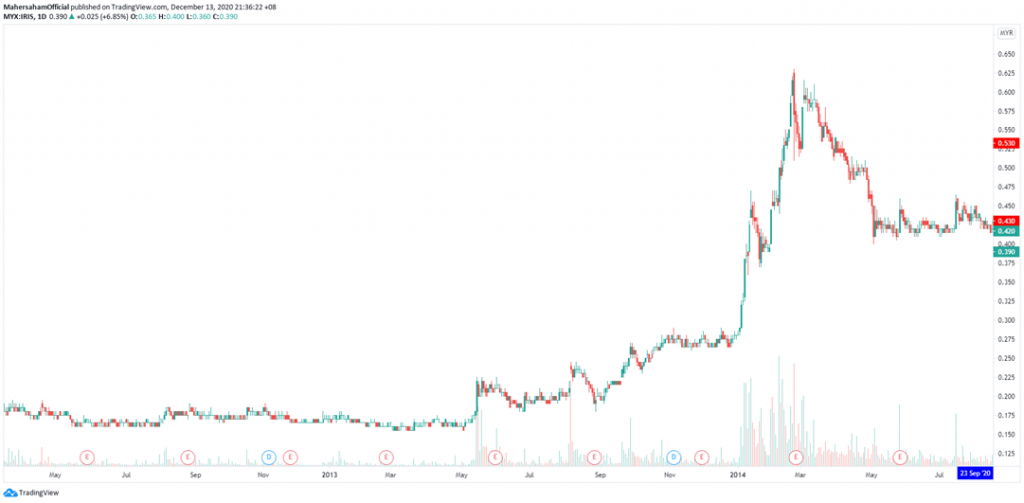
Rounding Bottom
The rounding shape does not need to be a perfect curve -- an approximate curved shape is sufficient.
The rounding bottom is considered one of the most powerful chart patterns.
Why?
For those who have studied volume price analysis, the three phases will be familiar: the accumulation phase, the public participation phase, and the distribution phase.
Along the bottom of the pattern, the accumulation phase takes place. The accumulation phase is a sideways phase where Smart Money or syndicates are collecting shares in large quantities.
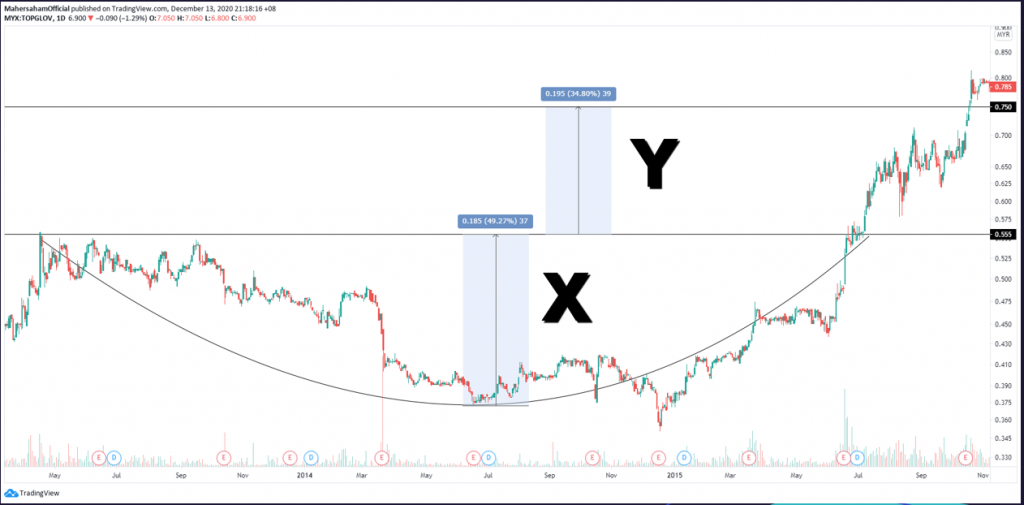
As mentioned earlier, you can measure your target price after a breakout.
The method is straightforward.
Refer to the diagram above.
Measure the depth of the rounding bottom to the breakout point (marked X), then project that same measurement above the breakout (marked Y).
If the height of X equals 30 sen, then the height of Y also equals 30 sen.
This measurement represents the minimum target price. The actual price may go higher.
Inverted Head and Shoulder
This chart pattern consists of 3 parts: the left shoulder, the head, and the right shoulder -- but in an inverted position, with the head and shoulders pointing downward.
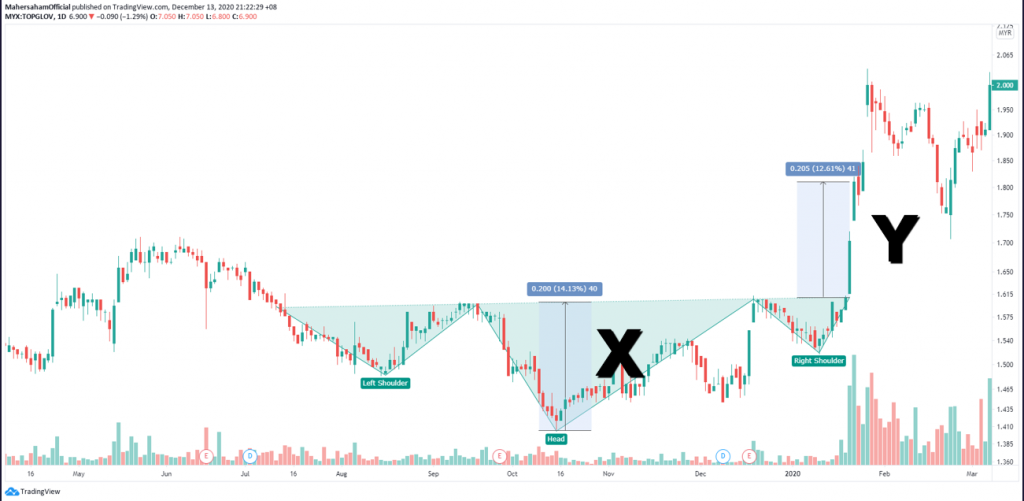
Similar to the pattern above, after a breakout, it signals a bullish move.
How do you measure the minimum target price for this pattern?
Measure the depth from the head to the neckline (marked X), then project that measurement above the breakout (marked Y). That value is the minimum target price.
Double Bottom
This chart pattern forms the shape of the letter W.
It has two bottom levels that are equal or nearly equal in price.
After a breakout, the price is expected to move upward (bullish).
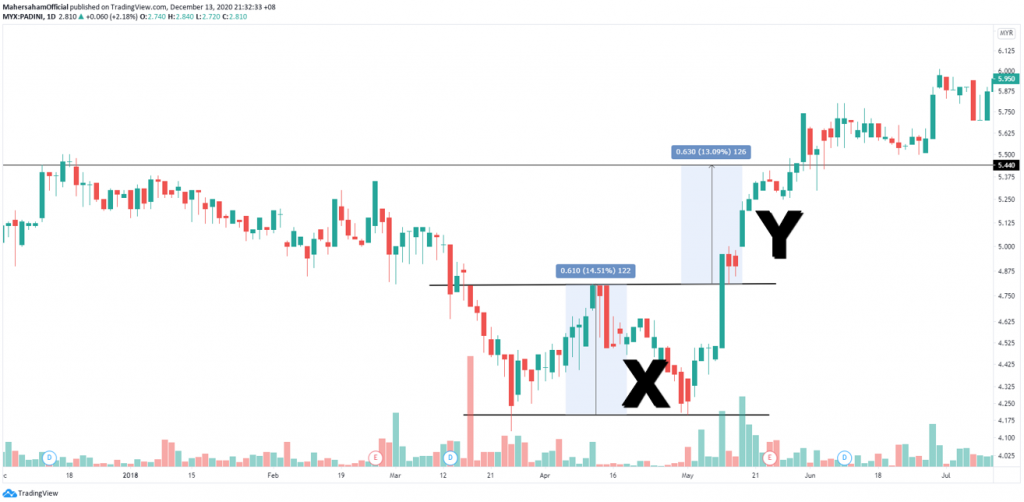
Measure the depth marked X, then project that measurement above the breakout marked Y. That value is the minimum target price.
V Bottom
A spike V bottom shows a sharp formation at the bottom. It forms without giving any prior signal.
This situation is difficult to trade, and the best approach is to exit the market during such formations.
For this type of chart pattern, we cannot measure a target price.
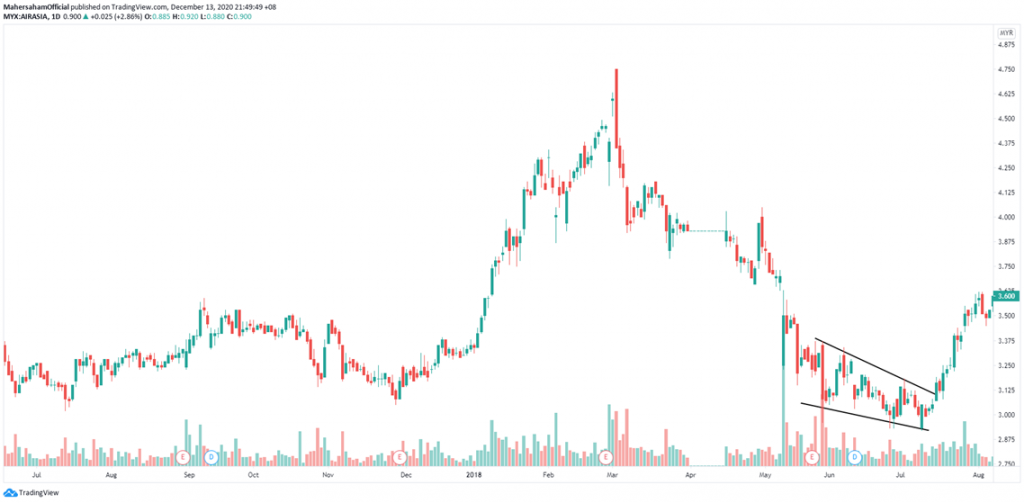
Falling Wedge
A wedge shape is similar to a diagonal. After a falling wedge pattern completes, the stock price typically rises.
2. Bearish Chart Patterns
When a bearish chart pattern completes, the stock price is expected to fall.
Examples of bearish chart patterns include:
- Rounding Top
- Head and Shoulder
- Double Top
- Triple Top
- V Top
- Rising Wedge
Head and Shoulder
This chart pattern, like the inverted head and shoulder, consists of 3 parts: the left shoulder, the head, and the right shoulder.
The peak of the head must be the highest point among the three parts.
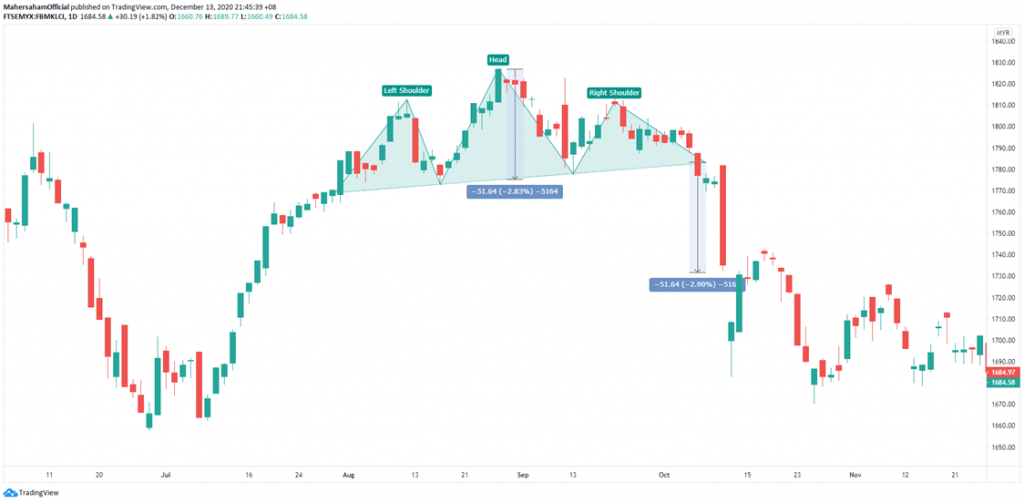
Unlike the inverted version, once the support level is broken, the price will move bearishly downward.
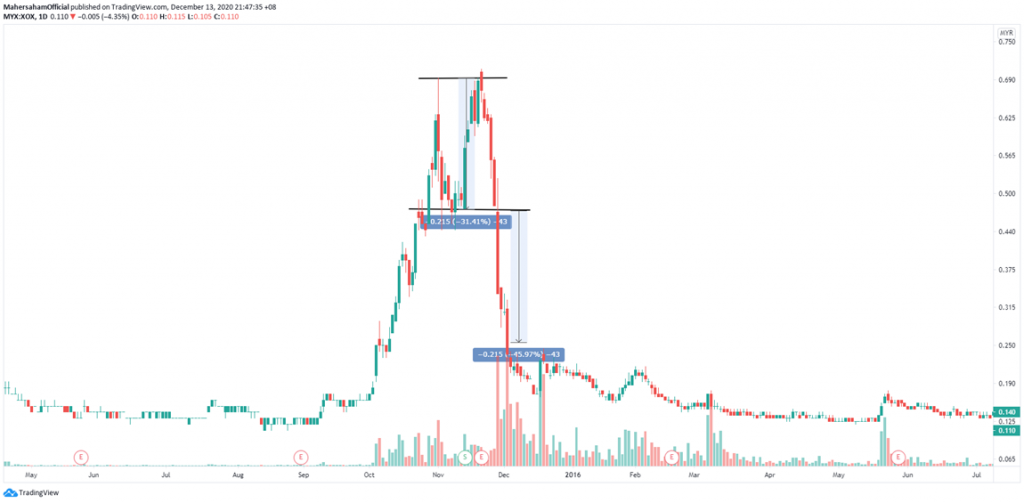
Double Top
This chart pattern forms the shape of the letter M.
It has two top levels that are equal or nearly equal in price.
Once the support level is broken, the price will show a downward movement.
V Top
A spike V top shows a sharp formation at the top.
Similar to the V bottom, it forms without giving any prior signal.
Rising Wedge
A wedge forms when you draw two steep trendlines that converge into a wedge pattern, as shown in the image below.
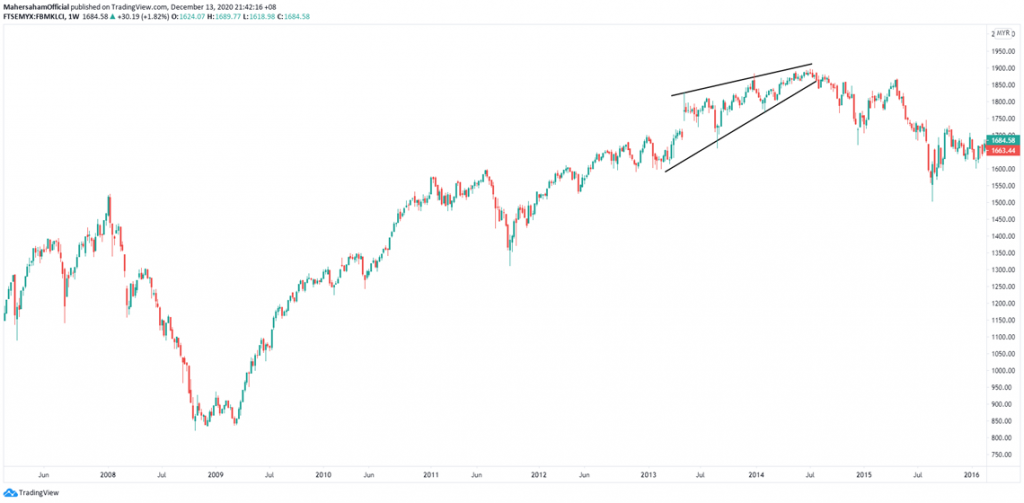
When the price breaks below the support level, it indicates the price is likely to fall further and create a new support level.
Conclusion
Before purchasing any stock, you need to understand technical analysis so that you know the right price to enter (buy) and exit (sell).
FAQ: Reversal Chart Patterns
What is a reversal chart pattern?
A reversal chart pattern is a technical analysis formation that signals a change in the prevailing trend -- from an uptrend to a downtrend, or from a downtrend to an uptrend.
What are examples of bullish reversal patterns?
Common bullish reversal patterns include the rounding bottom, inverted head and shoulder, double bottom, triple bottom, V bottom, and falling wedge.
What are examples of bearish reversal patterns?
Common bearish reversal patterns include the rounding top, head and shoulder, double top, triple top, V top, and rising wedge.
How do you confirm a reversal chart pattern?
A reversal chart pattern is only confirmed after a breakout occurs. Until the breakout happens, the pattern remains unconfirmed.
How do you calculate the target price from a reversal pattern?
Measure the depth of the pattern (marked X) from the lowest point to the breakout line, then project that same distance above the breakout point (marked Y). This gives you the minimum target price.
Improve Your Investment Knowledge
Successful investing starts with solid knowledge.
Investment Basics:
Download our free ebook for a complete guide.
Open a CDS Account:
Ready to start? Open a CDS account today.