We Backtested 84 of Our Own Stock Screeners. 26 Beat the Market.

Screener Mahersaham has more than 90 automated scanners. The question rarely asked, and answered even more rarely: how many of them actually work?
We tested them. The answer isn't comfortable, and we're publishing all of it.
How We Tested It
We took every live Bursa scanner on this site and ran its signal against 1,024 Bursa Malaysia counters from 2002 to 2026 - 38.1 million signal events.
The method is simple and open to challenge by anyone:
- Enter at the opening price the day after the signal fires
- Exit at the closing price 5, 10 and 20 days later
- Compare against a baseline: what you'd get from buying a random counter in the same market over the same period
That baseline is the whole point. A scanner can look profitable and still be useless, if that profit is no better than buying anything at all. So our measure isn't "how much profit" - it's "how much more than a random buy."
Bursa 20-day baseline: +0.26% for 2002-2020, and -0.17% for 2021-2026. Baseline win rate: 44.4% and 42.2%.
Every scanner had to be positive in both periods, with a minimum sample (300 events in the older period, 100 in the newer one). One good period isn't enough - that can just be luck.
The Result: 26 Out of 84
26 passed. 58 failed.
That's not a typo. Less than a third of the scanners on this site beat buying a random counter, when used standalone.
Before you close this page, read the next section. The pattern in the 58 failures is more useful than the list of 26 winners.
What Works
The scanner names below match exactly what's displayed in Screener Mahersaham - you can search for them directly using the same name.
| Scanner | Sample | Vs. Baseline | Win Rate |
|---|---|---|---|
| RS Line New High Scanner | 17,594 | +1.51% | 46.9% |
| 52-Week High Breakout Scanner | 5,952 | +1.39% | 45.7% |
| Near 52-Week High Uptrend Scanner | 87,582 | +1.29% | 47.8% |
| VCP Squeeze Breakout Scanner | 6,125 | +1.15% | 45.2% |
| Scanner for ichimoku perfect setup advanced technical analysis signals | 30,181 | +1.09% | 45.7% |
| Ichimoku Strong Uptrend Scanner | 87,468 | +0.82% | 44.8% |
| Ichimoku Perfect Bullish Scanner | 94,775 | +0.79% | 44.9% |
| MA50 Cross Above MA200 Scanner | 1,760 | +0.51% | 40.7% |
Look at the win rates. Even the best one is only 47.8%. That means you'll still be wrong more often than right. These scanners are profitable because the wins are bigger than the losses, not because they're rarely wrong.
What Doesn't Work
| Scanner | Sample | Vs. Baseline | Win Rate |
|---|---|---|---|
| MACD Cross Above Signal Scanner | 23,715 | -0.16% | 41.1% |
| RSI Cross Above 50 Scanner | 35,380 | -0.22% | 39.8% |
| Bollinger Bands Bounce Off Lower Scanner | 44,850 | -0.28% | 41.9% |
| SAR Bullish Flip Scanner | 21,667 | -0.28% | 41.0% |
| Stochastic Cross Above 20 Scanner | 23,543 | -0.54% | 40.5% |
| Buy Ungu (Supertrend) Scanner | 6,642 | -0.75% | 38.0% |
| OBV Breakout Up Scanner | 32,394 | -0.90% | 39.0% |
| Volume Breakout Advanced Scanner | 1,608 | -1.24% | 37.4% |
All of them below the 42.2% baseline. Not by a little - consistently, across tens of thousands of events.
The Real Pattern: Not the Scanner, But the Type
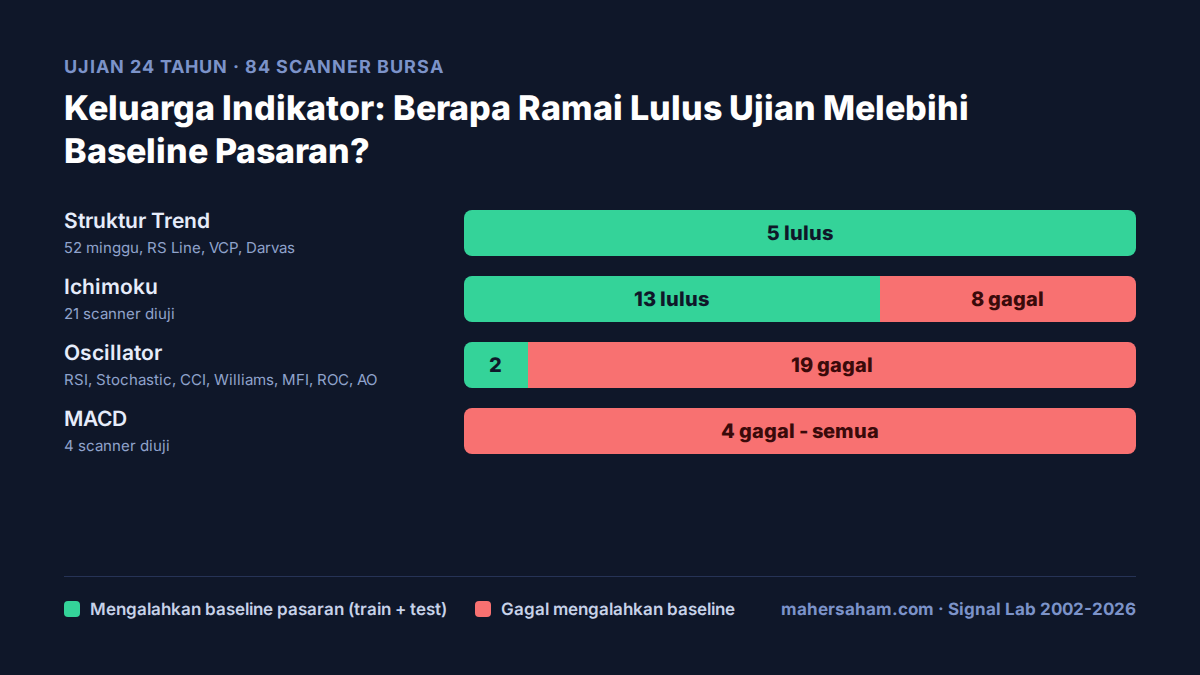
This is the most useful part. When we grouped results by indicator family, the pattern is too clear to ignore:
| Family | Passed | Failed |
|---|---|---|
| Trend Structure (52-week, RS Line, VCP, Darvas) | 5 | 0 |
| Ichimoku | 13 | 8 |
| Oscillator (RSI, Stochastic, CCI, Williams, MFI, ROC, AO) | 2 | 19 |
| MACD | 0 | 4 |
Every single trend-structure scanner passed. Every single MACD scanner failed. 19 out of 21 oscillators failed.
Oscillators and MACD are the most popular indicators among retail investors. They're also the ones that fail most on Bursa. That's not a coincidence - it's because these indicators are trying to answer the wrong question.
An oscillator tells you something is already "too high" or "too low." In a trending market, "too high" isn't a reason to sell - it's a reason to watch. This isn't just our opinion. According to StockCharts, during a healthy uptrend RSI typically reaches overbought territory on every rally but rarely falls below 40 on pullbacks - meaning sustained "overbought" isn't a reversal signal, it's a sign the trend is still strong. The stocks that rise the most will look overbought for their entire climb. If you sell every time an oscillator shows overbought, you're selling your winners too early.
MACD has a different problem: whipsaw in sideways markets. Small and mid-cap Bursa counters usually spend more time moving sideways than trending, and in that condition the MACD line and signal line cross back and forth repeatedly with no real trend behind them - every crossover looks identical to a genuine one. IndicatorVault explains that trend-following indicators like this "constantly weave back and forth, generating countless false buy and sell signals (whipsaws)" when a market is ranging - and applying a trend-following strategy in that condition "destroys trading capital quickly." That's exactly the pattern we found: MACD doesn't fail because its logic is wrong, but because Bursa spends a lot of time in the exact condition MACD wasn't built to handle.
Trend structure, on the other hand, tells you something is strong right now, not "too" anything. On Bursa, that's the more useful question. And this isn't a Bursa-only coincidence either - it's known as the "52-week high effect," a widely documented market anomaly. According to Trends & Breakouts, the research that formalized this pattern "found that nearness to the high carried predictive power the raw return figure alone missed" - when price breaks through its 52-week high, the old resistance level flips into new support, because the anchoring bias that previously capped the valuation is finally released. That's why the trend-structure family (52-week, RS Line, VCP, Darvas) passed 5 out of 5 in our test - it isn't answering "is the price too high," it's answering "is the price strong enough to keep breaking through resistance."
The same conclusion showed up in our separate study on combining Fibonacci, MACD and Ichimoku: MACD as an entry trigger made the setup worse, while Ichimoku confirmation improved it. Two different studies, the same conclusion.
So What's the Use of 58 Failed Scanners?
They're still useful - just not as a trigger. As a filter.
Here's the difference:
- A trigger says "buy now." Our data says these 58 scanners aren't qualified to do that job.
- A filter says "here's a shortlist worth studying." For that job, they still have value.
A practical example. The RSI Cross Above 50 Scanner alone returns -0.22%. But if you use it to narrow 900 Bursa counters down to the 30 whose momentum just turned, then you yourself check the trend structure of each one on the chart, you're using it correctly.
A screener saves you time. It doesn't replace your judgment. The numbers above are proof of why that difference matters.
That's why we didn't remove these 58 scanners. We just stopped pretending they're buy signals.
A Lesson About Sample Size
The scanner with the best number in the entire test was the Golden Cross Advanced Scanner: +4.68% above baseline. It didn't make the passing list.
The reason: the newer-period sample was only 56 events. Our minimum threshold is 100.
If we'd included it, it would be the headline of this article. And it might mean nothing at all - with only 56 events, one or two counters that spiked can move the entire number.
This happens in every performance study you'll ever read online. When someone shows you an impressive return, the first question isn't "how much percent" - it's "on how many events." If that answer isn't given, the number can't be trusted.
How many is actually enough? According to a guide by Backtestbase - which references the work of Marcos López de Prado, a respected quantitative finance researcher in the field - around 30 events is the statistical floor based on the Central Limit Theorem, 100 events starts giving basic reliability, and 200 to 500 events gives institutional-grade confidence. But count alone isn't enough: the same guide stresses that "500 trades in 6 months (one regime) is less reliable than 100 trades over 5 years (multiple regimes)." That's why our threshold spans 24 years of data, not one or two years that happened to be bullish.
We also removed one scanner (Trend Follower Advanced Scanner) entirely from the table because it only fired 2 times in the entire test period. Two events isn't data.
Limits of This Study
Stated plainly, because you deserve to know what these numbers can't tell you:
- Prices aren't adjusted for bonus issues and stock splits. Moves above 300% were filtered out as likely artifacts.
- Survivorship bias. Delisted counters aren't in the data, so the results are somewhat too optimistic. This isn't a minor issue - according to LuxAlgo, a study of US stock market data from 1926-2001 showed annualized returns of 7.4% in the complete dataset (including failed companies) versus 9.0% in the dataset that excluded failed companies - a 1.6 percentage-point-per-year gap purely from what was left out. Other cited research shows Sharpe ratios can be overstated by as much as 0.5 points and maximum drawdown underestimated by as much as 14 percentage points. We can't precisely measure how much this affects our own numbers, but the direction is clear: the real results are probably somewhat weaker than what's reported above.
- Past performance isn't a guarantee. Markets change. A scanner that passes today could stop working.
- This is a 20-day hold. A scanner that fails at 20 days might work over a different period, and vice versa.
- Standalone only. We didn't test every combination. Our separate research shows combining two signals can give 2 to 4 times the edge of a single signal.
Frequently Asked Questions (FAQ)
If 58 scanners don't work, why are they still available?
Because they're useful as a filter to narrow your search, even if they don't qualify as a buy signal. Removing a useful tool because it isn't a perfect one is a bad trade-off. What we removed was the claim that it's a buy signal.
Which scanner should I use if I'm just starting out?
Start with the trend-structure and Ichimoku families, since they were the most consistent in our test. But don't use any single scanner as your only reason to buy.
Why are the win rates all so low, even for the passing ones?
Because that's the reality of trading. A 47% win rate with average wins twice the size of average losses is still profitable. A system that wins 80% of the time but loses big when it's wrong is more dangerous.
Do these results apply to US stocks too?
No. Bursa and US markets behave differently, and some indicators that fail on Bursa work on the NYSE. Applying one market's tactics to another is one of the most expensive mistakes in technical analysis.
How can I verify these numbers myself?
Take any scanner, log its results daily for a few months, then compare against the FBM KLCI's movement over the same period. That's a rough test, but it teaches the right habit: compare against a baseline, not against zero.
Are premium scanners more effective than free ones?
Not automatically. In our test, what mattered was the type of indicator, not the subscription tier. Some free scanners passed and some premium scanners failed.
How much data is needed before a scanner can be trusted?
Not duration - event count. We use a minimum of 100 events in the test period, and 300 in the training period. Below that, the numbers are too easily moved by a handful of counters.
Conclusion
Out of 84 Bursa scanners we tested against 24 years of data, 26 beat the market and 58 didn't. The pattern is clear: trend-structure scanners work, oscillators and MACD don't.
That doesn't make the 58 scanners useless. It makes them filters, not triggers. That difference is what determines whether a screener helps you or misleads you.
We're publishing these uncomfortable numbers because you deserve to know the tools you're using, limits included.
To start using the screener the right way, the next step is simple.
You'll need a CDS Trading Account to trade on Bursa Malaysia, and the same account opens access to foreign stocks like the US and Hong Kong - open a CDS Trading Account here.
If you're still new and want to understand the basics before touching any scanner, our stock market basics ebook is a free download.