Bilateral Chart Patterns: Triangle, Wedge & Pennant Trading Guide
Types of Chart Patterns
There are 3 types of chart patterns:
- Reversal Chart Pattern
- Continuation Chart Pattern
- Bilateral Chart Pattern
Key Points in Chart Patterns
- To form a line, you need at least 2 points minimum.
- Breakouts usually occur at the 2/3 point near the end.
- The pattern fails if there is no breakout above or below until the apex (the point where the two lines meet).
- The target price is measured by looking at the base of the triangle compared to the breakout level.
- Entry point is at the breakout.
- Stop price is placed below the breakout level or at the opposite trendline.
- As the triangle pattern completes, volume decreases.
- At the breakout, volume increases significantly.
- During a retest, volume is small.
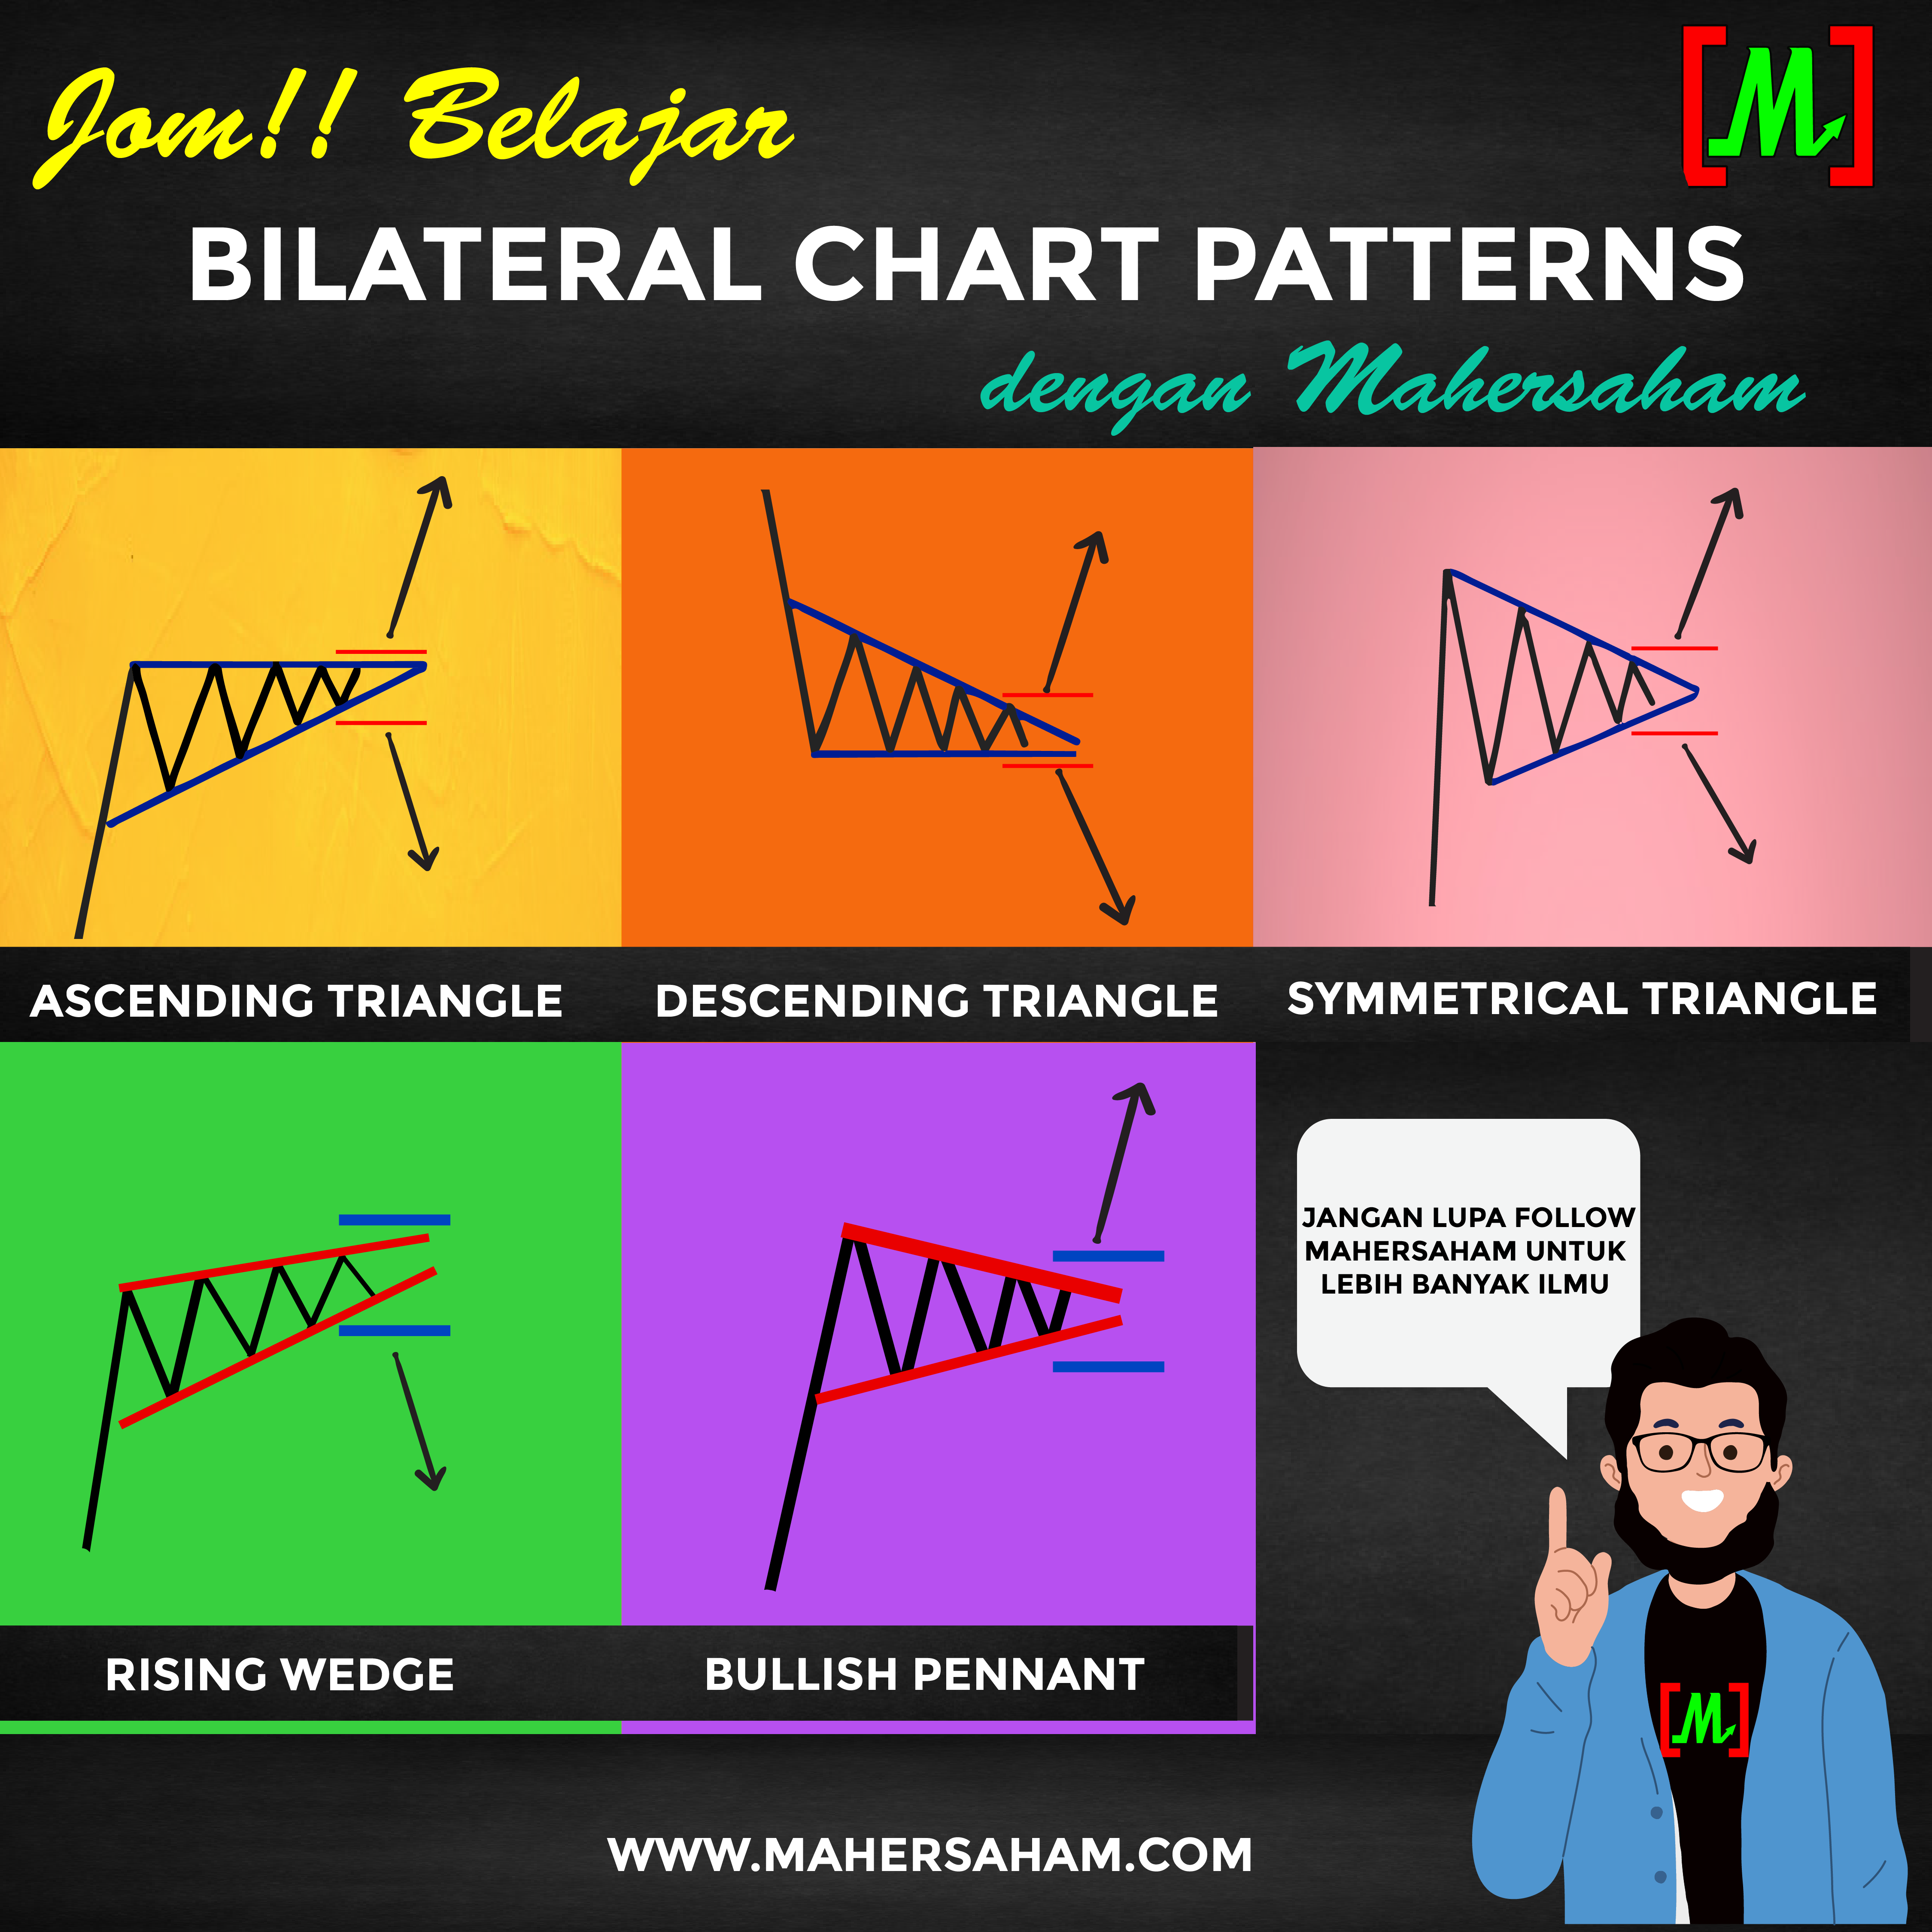
What Is a Bilateral Chart Pattern?
According to the dictionary, bilateral means involving two sides.
It can be a bit confusing.
Why?
Because we are not yet certain which direction the trend is heading.
It can move in either direction — either upwards or downwards.
It may seem like there is no clear function since we do not know where it is going, but that is exactly why we should be more cautious.
To get confirmation, you need to wait for a breakout.
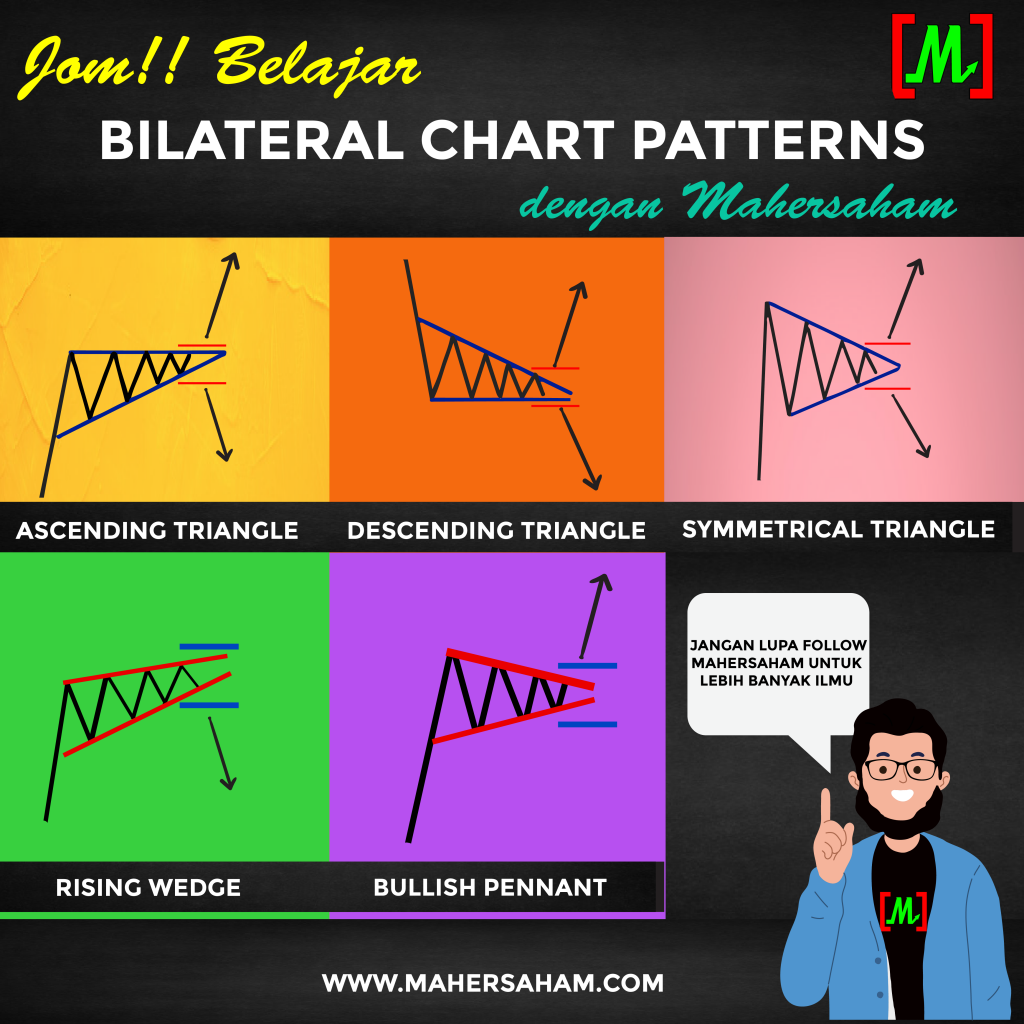
Types of Triangle Chart Patterns
- Symmetrical Triangle
- Ascending Triangle
- Descending Triangle
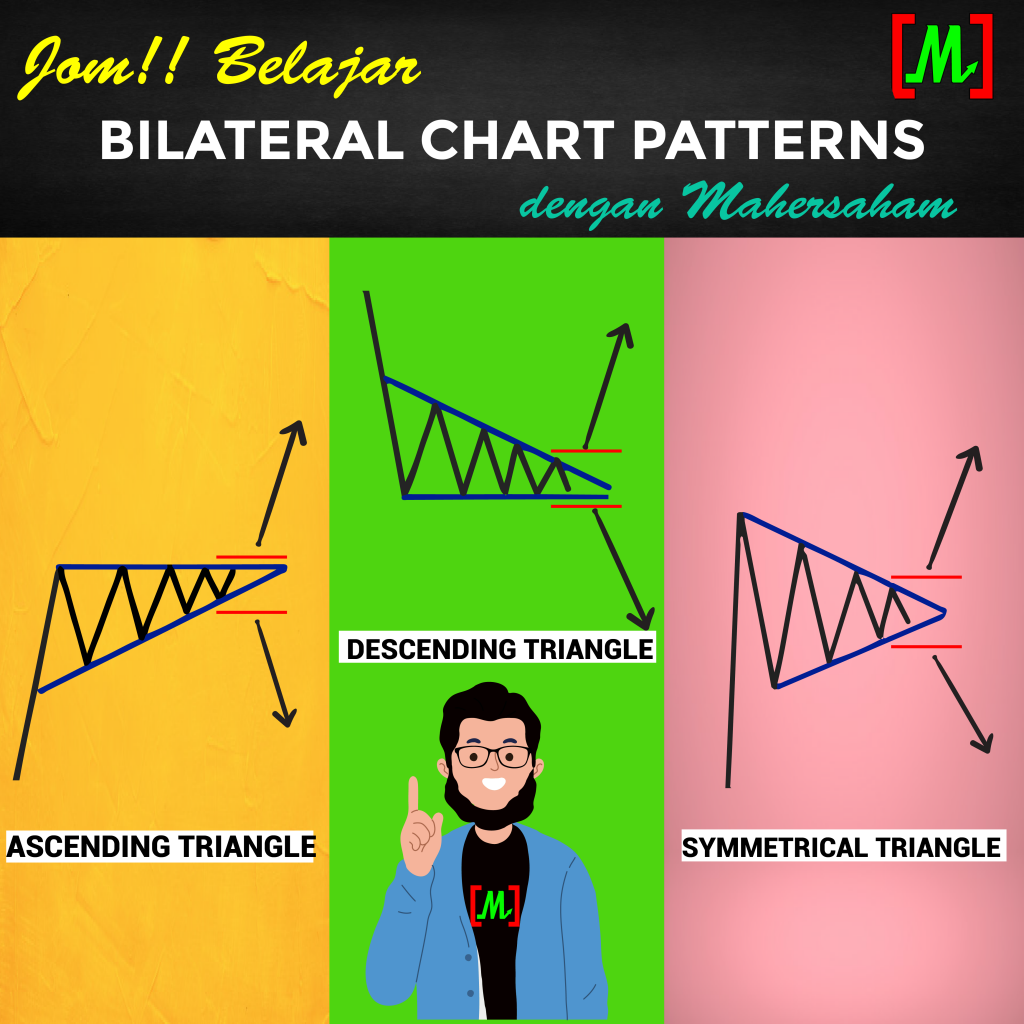
Ascending Triangle
This pattern forms a triangle pointing upwards.
The upper part of the triangle is flat (horizontal), which acts as resistance.
The lower part of the triangle is constantly rising, which acts as support.
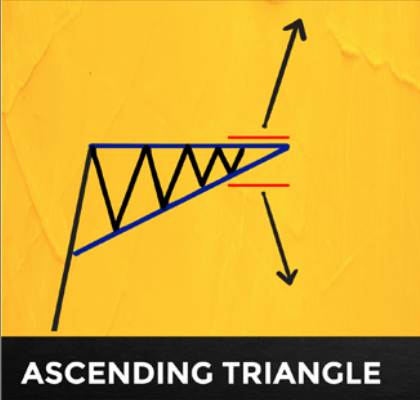
You need to wait for a breakout first before you can determine which direction the price is heading. It could go upwards, but it could also go downwards.
Usually, the trend continues upwards, but it can also reverse downwards.
Descending Triangle
This pattern forms a triangle pointing downwards.
The lower part of the triangle is flat (horizontal), which acts as support.
The upper part of the triangle is constantly declining, which acts as resistance.
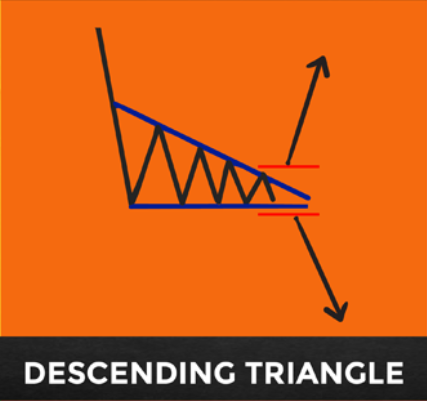
You need to wait for a breakout first before you can determine which direction the price is heading. It could go upwards, but it could also go downwards.
Usually, the trend continues downwards, but it can also reverse upwards.
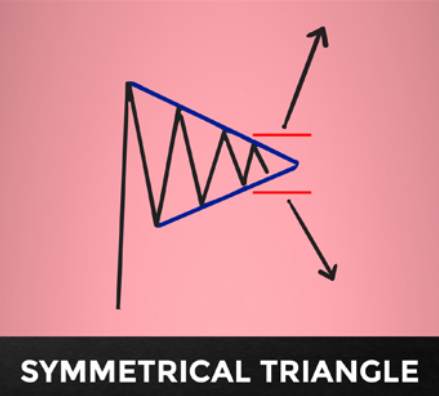
Symmetrical Triangle
A symmetrical triangle is often viewed as a continuation pattern, signalling a period of consolidation within a particular trend before it resumes.
It is formed by a support line and a descending resistance line.
Typically, the price of the instrument will bounce between the trendlines.
The price moves closer and closer to the apex (that is the name for the point where both lines meet), before breaking out in the direction of the previous trend.
Symmetrical Triangle (The Coil)
It acts as a reversal if it appears at cycle extremes or at significant resistance or support levels.
It acts as a continuation if it appears at cycle midpoints.
Differences Between Triangle, Wedge, and Pennant
There are two types of triangles: ascending and descending.
For an ascending triangle, the upper part is flat (horizontal) while the lower part is constantly rising.
This is different from a descending triangle, where the lower part is flat (horizontal) and the upper part is constantly declining.
What about the wedge?
In Malay, a wedge is called "baji".
A wedge (baji) is an object with one pointed end and one thick edge.

Image credit: Google
A pennant is a long, narrow triangular flag.
Refer to the image below.

Image credit: Google
We hope this guide has been helpful!
FAQ on Bilateral Chart Patterns
What is a bilateral chart pattern?
A bilateral chart pattern is a chart formation that can move in either direction — either up or down. It differs from reversal and continuation patterns because it does not give a clear directional signal until a breakout occurs.
What are the most common examples of bilateral chart patterns?
The most common examples are the symmetrical triangle, ascending triangle, descending triangle, wedge, and pennant. Each has its own distinct shape and characteristics that investors need to understand.
How do you identify a breakout on a bilateral pattern?
You need to watch for when the price breaks through the upper line (resistance) or the lower line (support) of a pattern with high trading volume. A valid breakout is usually accompanied by a significant increase in volume.
Are bilateral chart patterns suitable for beginner investors?
Yes, bilateral chart patterns are suitable for beginners to learn as they help in understanding stock price movements. However, new investors are advised to combine chart pattern analysis with fundamental analysis before making investment decisions.
Interested in starting your share investing journey? Open a CDS account with Mahersaham today and take the first step into the world of investing.
Want to learn the basics of shares from scratch? Download the free Mahersaham ebook now and understand investment concepts with ease.
Further reading: