Continuation Chart Patterns: Bullish Trading Guide
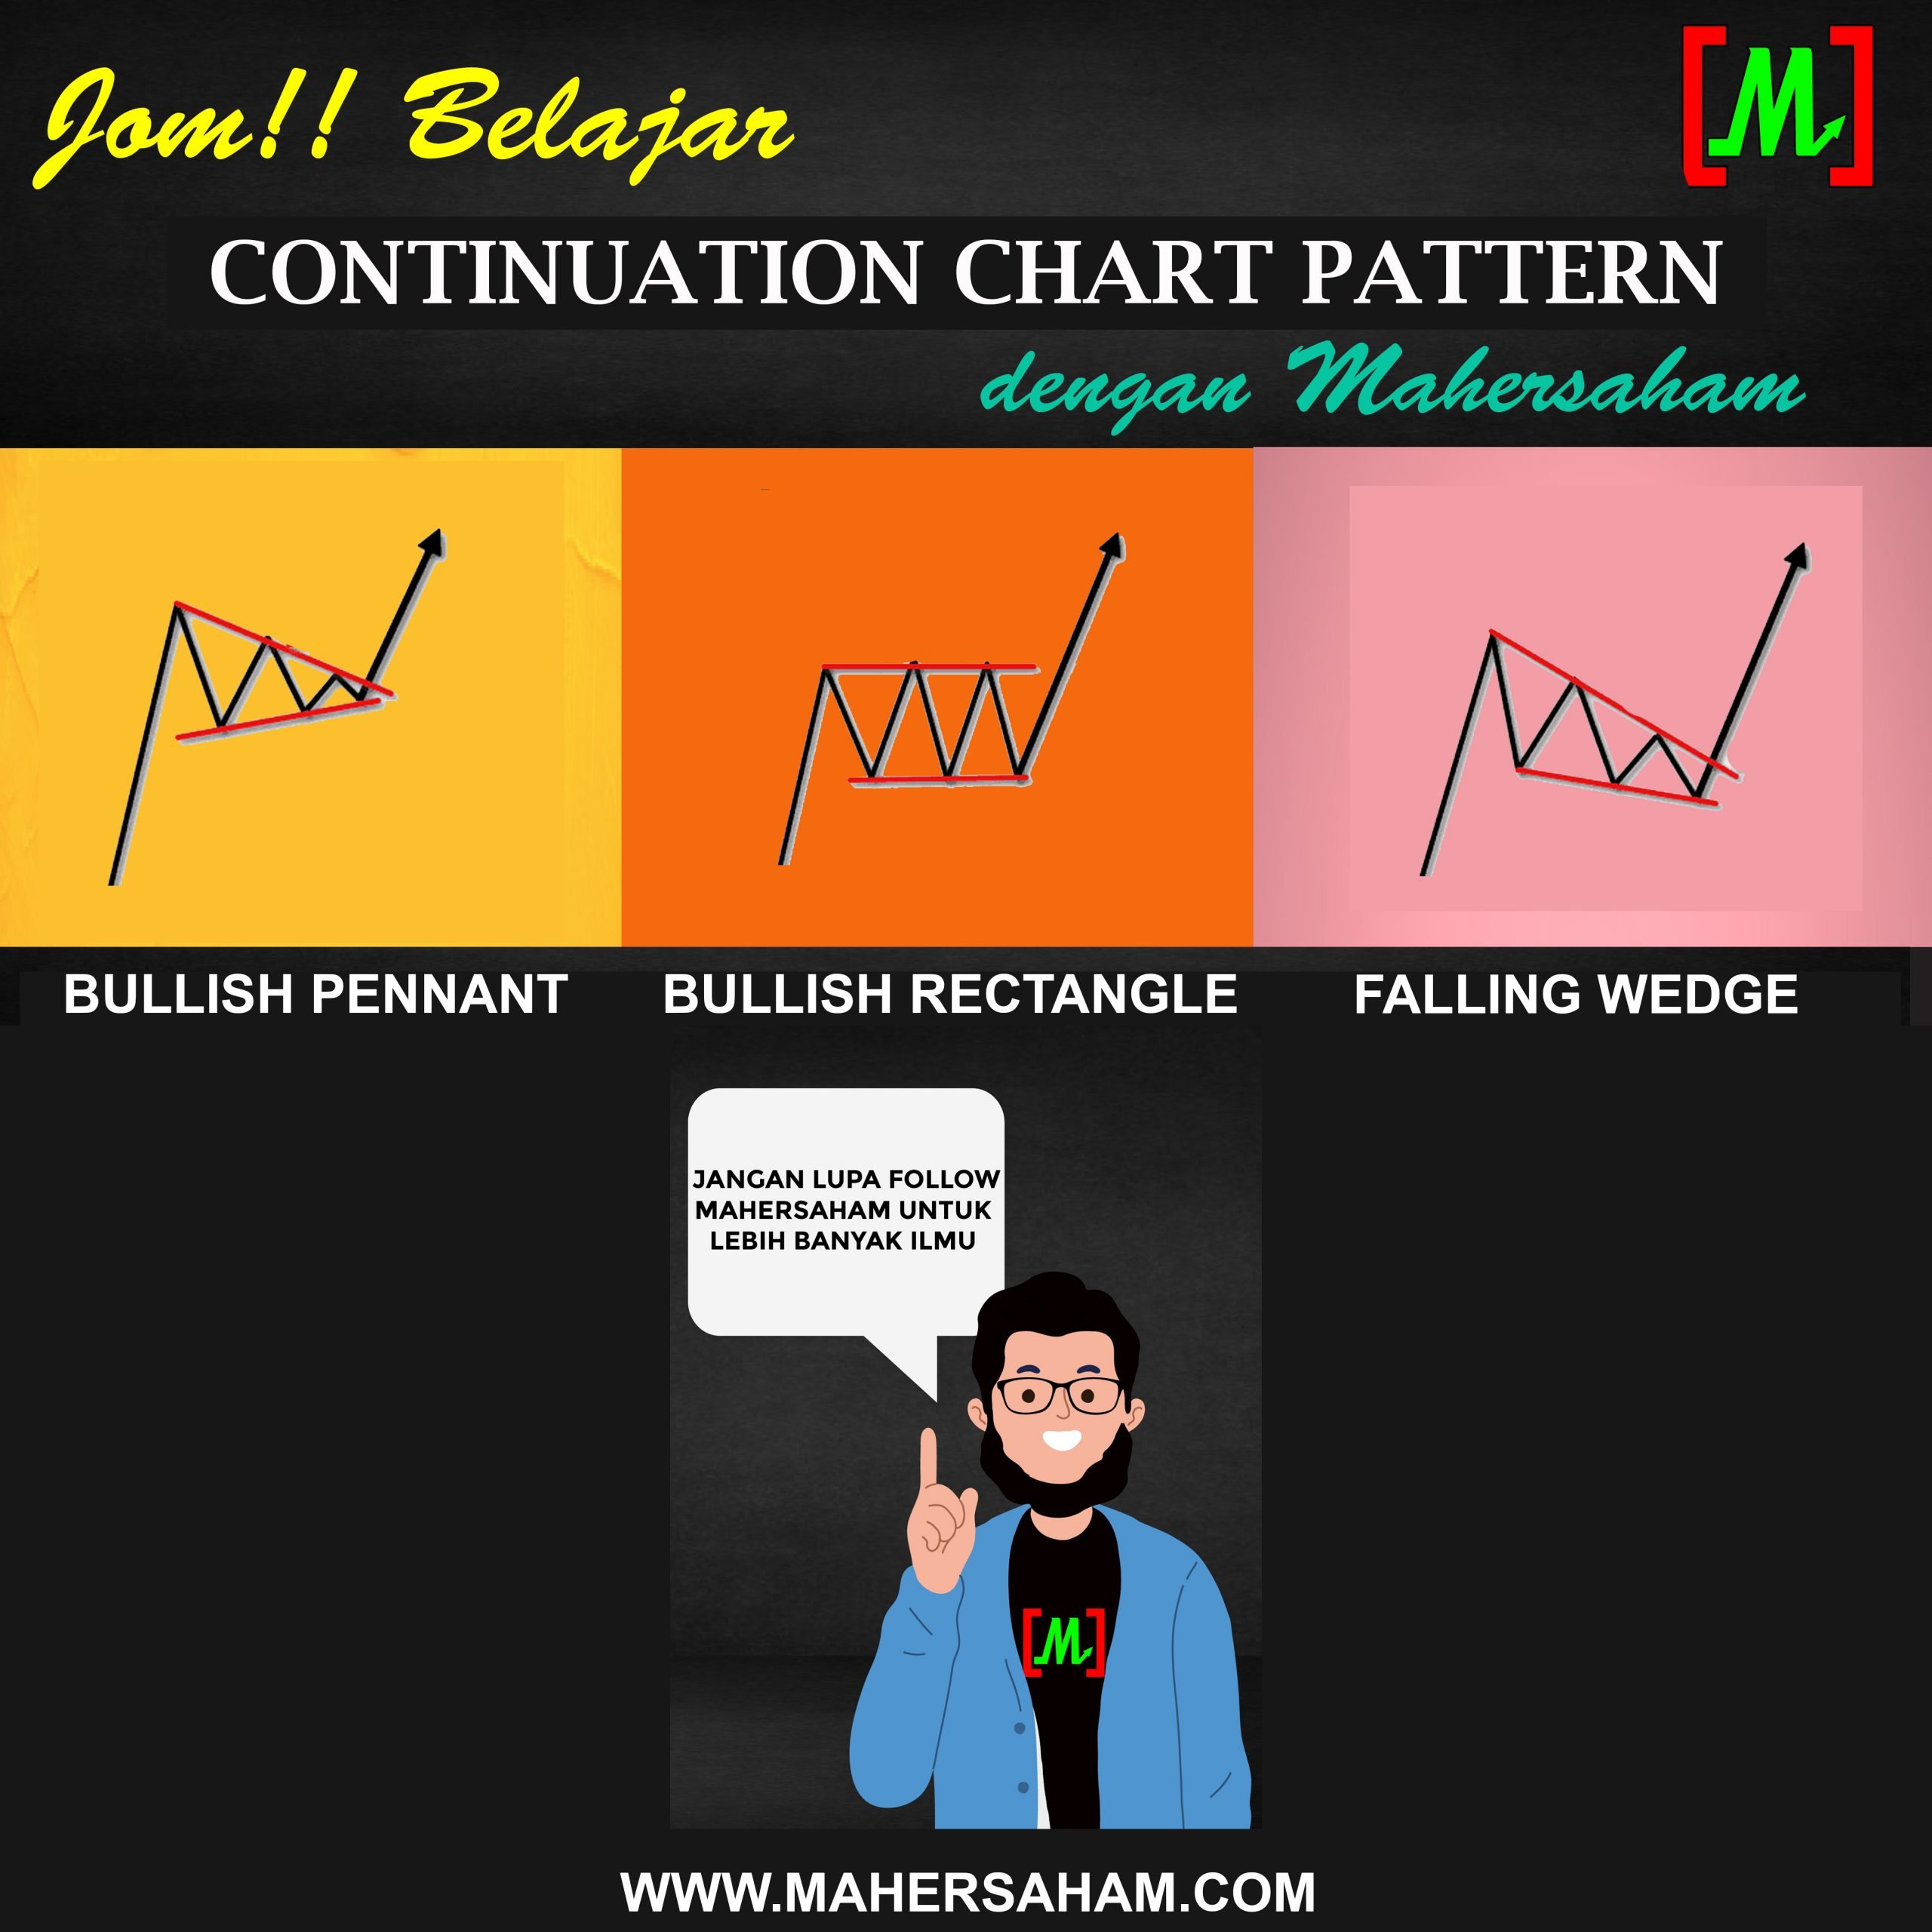
Chart Patterns
- Reversal
- Continuation
- Bilateral
Continuation Chart Pattern Bullish
A bullish continuation chart pattern refers to a pattern that signals the continuation of a bullish trend or an upward price movement.
There are 3 chart patterns in this category:
- Falling Wedge
- Bullish Rectangle
- Bullish Pennant
Falling Wedge
The stock movement is still in an uptrend, but then there is a slight decline. However, this decline is not a sharp drop.
Some traders also refer to this decline as a sideways movement.
Why?
Because after this phase, the price will break out to continue the uptrend.
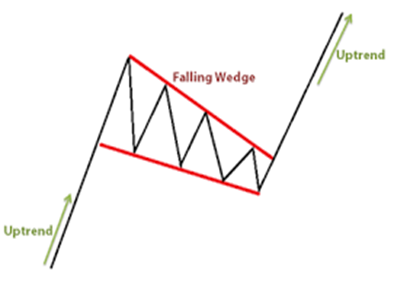
How do you detect a falling wedge?
The conditions for a falling wedge are:
- There are two parallel straight lines sloping downwards.
- Inside the wedge, there are candles (regardless of colour) in a sideways state (a sideways movement that slopes slightly downward).
You can refer to the diagram below.
For those who have learnt the Elliott Wave technique, this technique discusses the falling wedge, which is also known as a diagonal.
The falling wedge is one of the most reliable patterns.
Why?
When a falling wedge occurs, the result is a faster uptrend movement.
How do you know if the pattern is still in an uptrend?
As long as the stock price does not break the previous support level.
Where you place the support level is up to you.
Some traders place the support at the nearest level (before this), while others place it slightly lower according to their own trading plan.
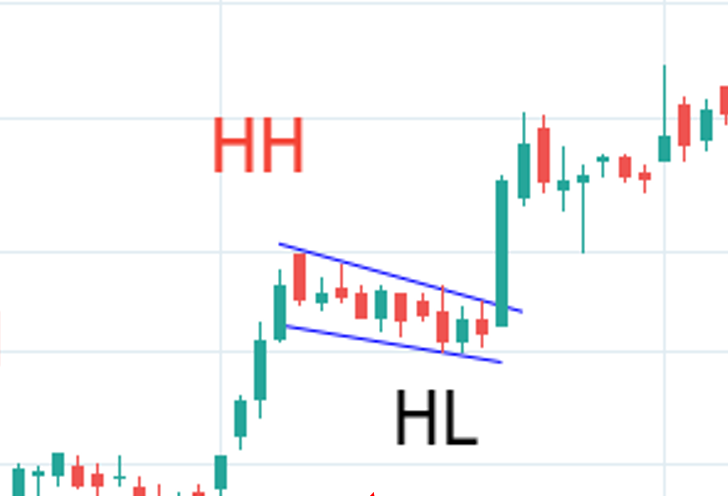
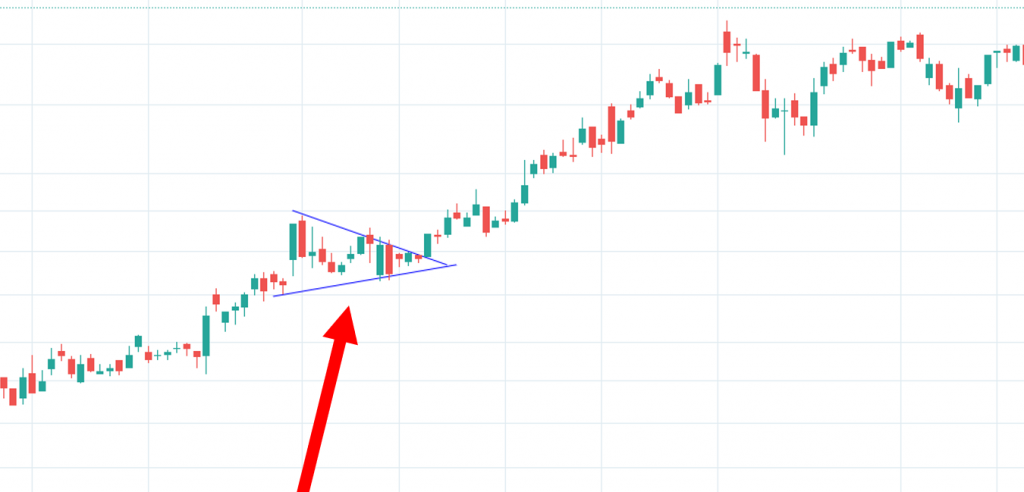
The diagram above is an example of a falling wedge continuation chart pattern.
If you look at the example above, it is quite impressive — a long marubozu candle appeared right after the breakout.
Bullish Pennant
According to the dictionary, a pennant is a long, narrow triangular flag.

What does a bullish pennant look like?
The bullish pennant shape is quite small, and the candles inside the pennant are few — not many. This is different from the falling wedge.
In addition, it also resembles a symmetrical triangle or semi triangle.
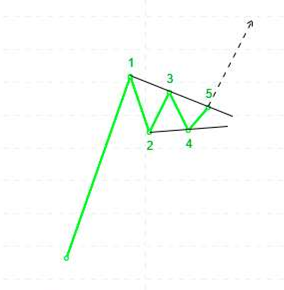
Based on the diagram above, you can see that the bullish pennant has two straight trendlines that are not parallel.
Inside it, there are candles forming small lines numbered 1, 2, 3, 4, and 5.
This is different from the falling wedge mentioned earlier — if you look at the falling wedge, both lines are parallel.
Does the price break out at wave 3 in a bullish pennant?
Usually, the breakout happens after waves 1, 2, 3, 4, and 5 — then the price shoots straight up.
You can refer to the example below.
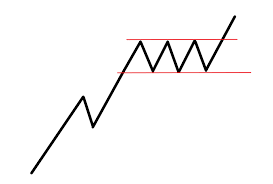
Bullish Rectangle
This is one of the easiest patterns to identify.
It occurs during a sideways movement.
Initially, the stock makes an uptrend, then goes sideways for a while before continuing the uptrend again.
Why does a sideways movement happen?
Usually, the sideways movement occurs because the stock is building momentum for a further rise.
Once the sideways phase is complete, the price will break out.
How long does it take?
Nobody knows for certain.
Some sideways phases last a long time, while others are very brief.
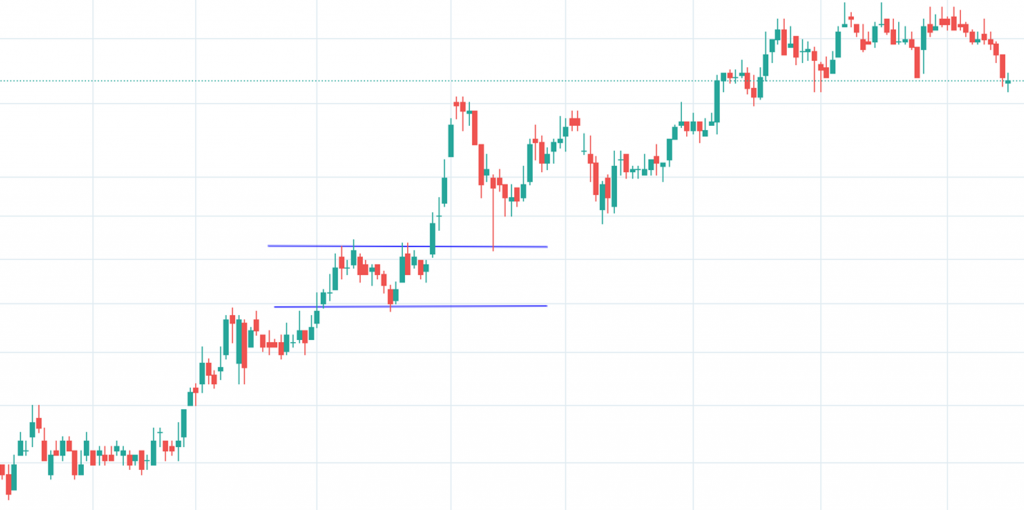
You can refer to the diagram above for an example of a bullish rectangle.
FAQ on Continuation Chart Patterns
What is a continuation chart pattern?
A continuation chart pattern is a chart formation that indicates the price will continue its existing trend after a consolidation phase. It signals that the original momentum is still strong.
How do you identify a bullish pennant on a chart?
A bullish pennant forms when the price rises sharply (the flagpole) and then consolidates in a small triangle shape. When the price breaks out upwards, it confirms the bullish continuation.
How long does the sideways phase in a bullish rectangle typically last?
The duration of the sideways phase in a bullish rectangle varies and there is no fixed timeframe. Some occur within just a few days, while others may take weeks before a breakout happens.
Can continuation patterns be used together with other indicators?
Yes, continuation patterns are more effective when combined with other technical indicators such as volume, RSI, and moving averages to confirm breakout signals and reduce the risk of false breakouts.
Interested in starting your share investing journey? Open a CDS account with Mahersaham today and take the first step towards building your investment portfolio.
New to shares? Download the free Mahersaham ebook now and learn the fundamentals of investing!
Further reading: