Bollinger Band Indicator & How to Use It on Tradingview
Assalamualaikum and hello. Greetings to all of you. For this article from the Mahersaham live session on 29 January 2021, I will be sharing with you all about how to use Bollinger Band on Tradingview.
What is Bollinger Band?
Why is it called Bollinger Band?
Well, it is named after its founder, John Bollinger, who developed it in the 1980s. He is still alive to this day.
Usage / Function
The Bollinger Band indicator was created to study a particular stock counter/company to see how volatile that counter is and the trend of that company.
1. Volatility — market conditions
2. Trend — market direction. Uptrend or downtrend. Look at where the candlestick appears.
Upper band = market uptrend
Lower band = market downtrend
Middle band = sideways
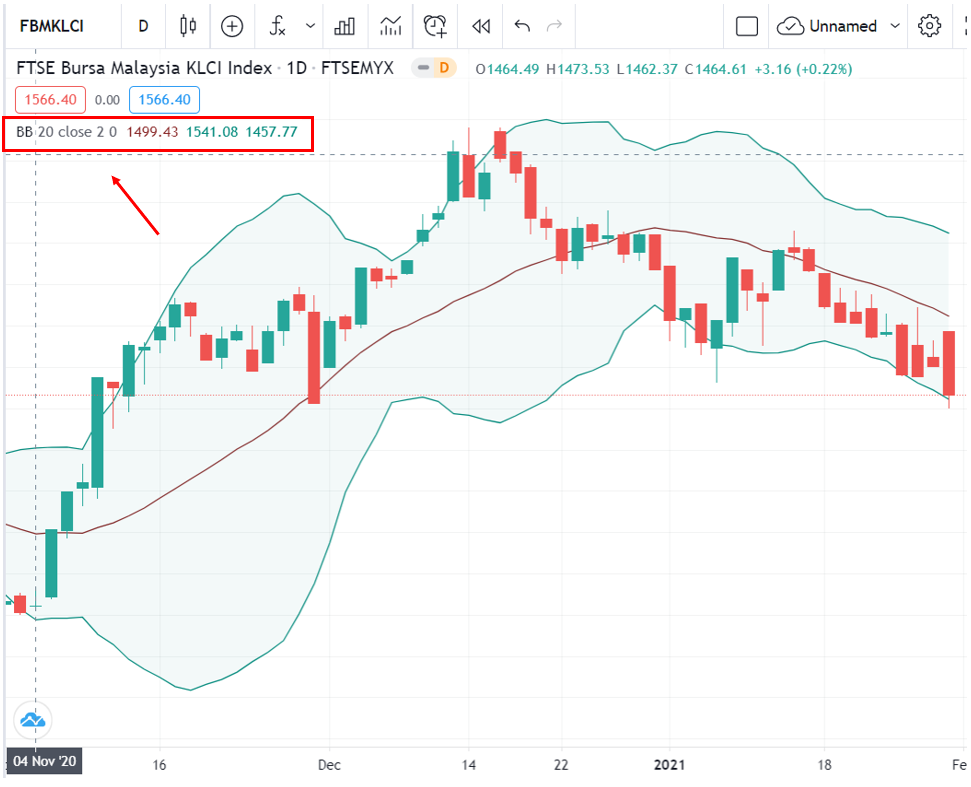
As usual, search for Bollinger Band in the indicator section as shown in the image above.
Bollinger Band forms three lines. The middle line in red is the MA (moving average) line.
If you want to learn more about MA (Moving Average), you can refer to the article on the Mahersaham App or click on the highlighted text.
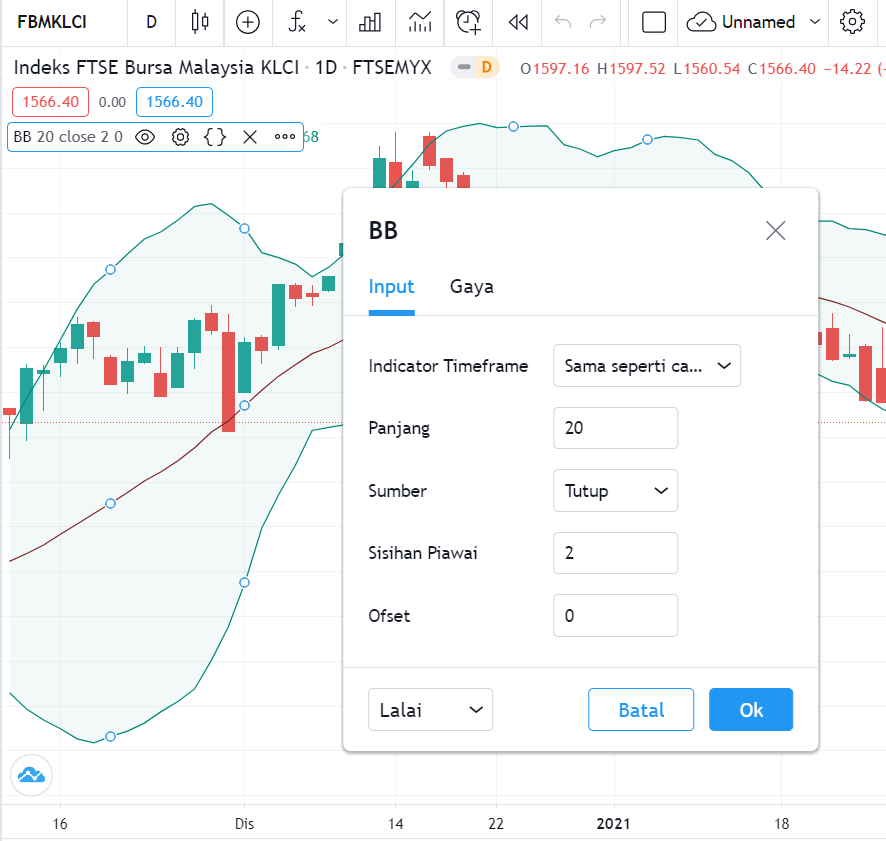
To make adjustments, you can click on the settings section. Here you will find length, source, standard deviation, and offset.
Length = period time. If you select 20, it means there are 20 candlesticks.
Source = close (if the candlestick is green, it will take the price at the top)
As I mentioned earlier, the middle line is the MA, while the upper and lower bands are lines that follow a formula.
Formula: MA + 2 x std
Why does the formula have 2? Because we take it from the standard deviation that we selected as 2 earlier, so the multiplier is 2.
Standard deviation is a tool used to identify the volatility of a particular data set.
Price movement is characterised as volatility. If it is more volatile, it means the rises and falls are more exaggerated.
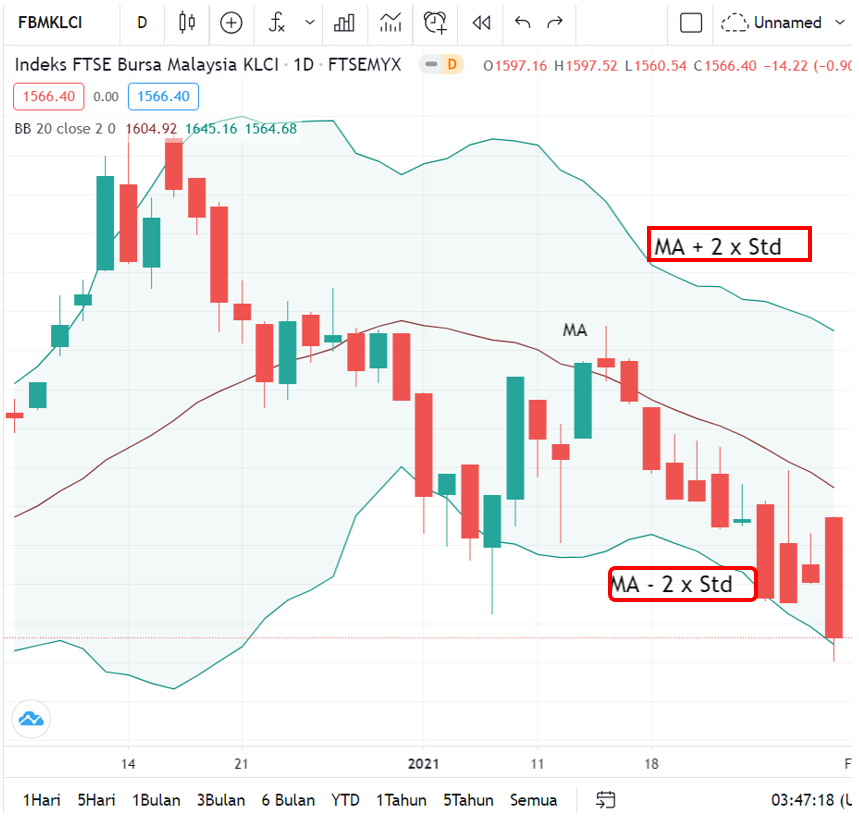
As shown in the image above, I have included the formula for the upper and lower lines. For the lower line formula, you need to change it to subtraction.
Is the middle line the same as MA 20?
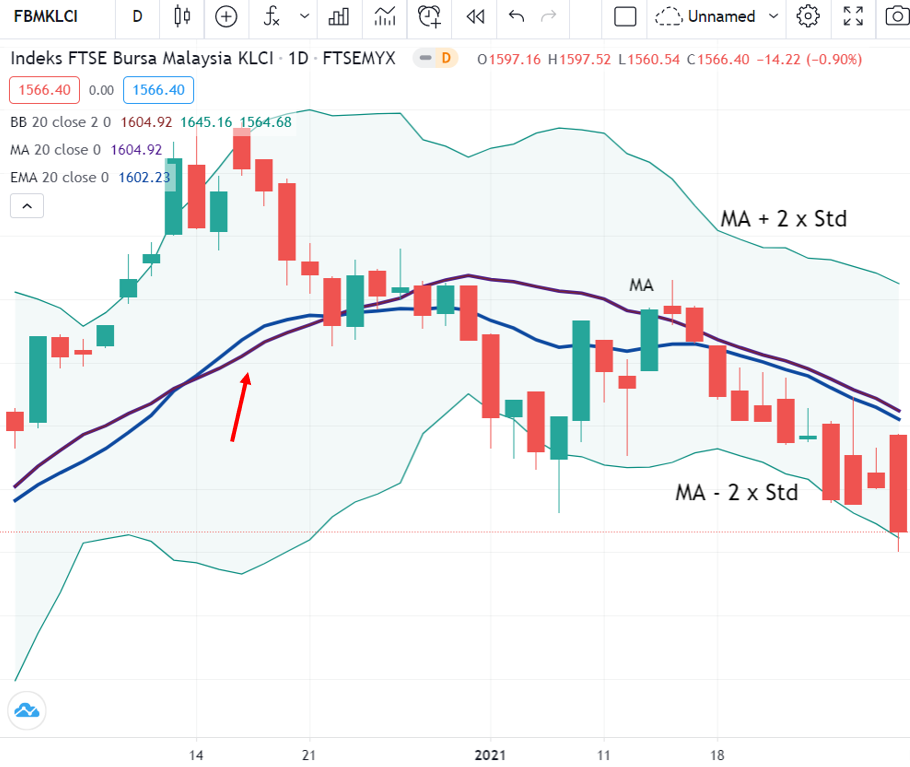
Question: Is the middle line of Bollinger Band the same as MA 20?
This is because some people say that the middle line is the same as EMA (Exponential Moving Average) and not MA (Moving Average).
So, in the image above, I have included both the MA and EMA indicators.
Blue line: EMA
Purple line: MA
The blue line clearly looks different from the middle line, but the purple line is closer to the middle line. So the middle line is exactly the same as MA 20.
Technique / How to Use Bollinger Band
Now that we know the calculation and formula, let us learn how to use Bollinger Band.
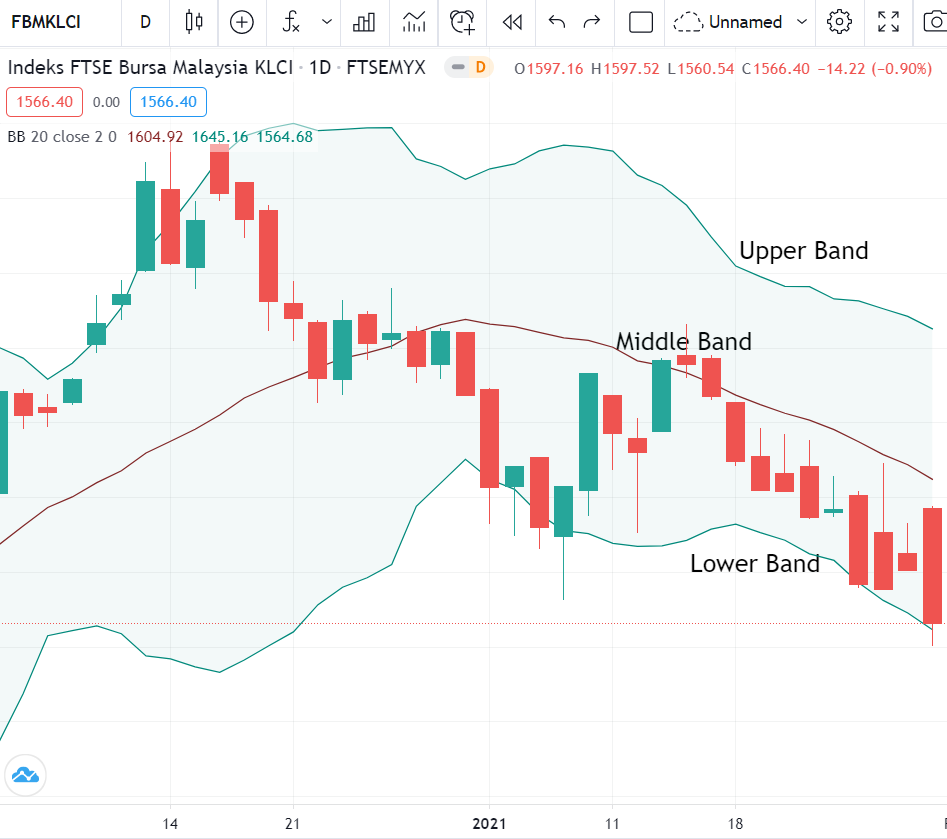
The top line is called the upper band, the bottom line is the lower band, and the middle line is the middle band.
There are 2 techniques for using the Bollinger Band indicator:
It can be used as support & resistance
Upper line: resistance
Lower line: support
Where should you buy?
Typically, traders use the middle line as a buy signal. However, there are 2 buying techniques:
i) When a green candle crosses above the middle line, it is a buy signal, and when a green candle reaches the resistance level, you sell.
ii) Buy at the lower support line. However, the risk lies in the cut loss level.
Conclusion
In conclusion, there are many indicators on Tradingview that you can use to find support and resistance levels. One of them is Bollinger Band.
Make sure the indicator you use is accurate and suitable for your stock analysis.
Tradingview Is an Essential Component of Technical Analysis
This article is one of the articles written in the Technical Analysis: Tradingview series. Technical Analysis is one of the branches related to stock research.
There are many more topics covered in the technical analysis learning series and how you can use Tradingview optimally to help you with stock research.
To view other topics related to Tradingview or Technical Analysis, head over to the Complete Guide to Technical Analysis.
Watch the YouTube video below and click now for a clearer learning experience.
Frequently Asked Questions (FAQ)
1. What is Bollinger Band and how does it work?
Bollinger Band is a technical indicator consisting of three lines: the upper band, middle band (SMA), and lower band. It measures market volatility and helps identify overbought or oversold conditions.
2. How do you interpret Bollinger Band in Tradingview?
When the price touches the upper band, it may indicate an overbought condition. When the price touches the lower band, it may indicate an oversold condition. A squeeze (bands narrowing) indicates low volatility and the potential for a breakout.
3. What is the best setting for Bollinger Band?
The default Bollinger Band setting is a 20-period SMA with 2 standard deviations. However, traders can adjust the settings according to their timeframe and trading style for more optimal results.
4. Can Bollinger Band be used for day trading?
Yes, Bollinger Band is suitable for day trading, especially when combined with other indicators such as RSI or MACD. It helps identify entry and exit points based on price volatility.
Want to start investing in stocks? The first step is to open a CDS account with Mahersaham. Also download the free stock basics ebook to learn from the basics with proper guidance.