Bollinger Band Squeeze: How to Spot Price Explosions Before They Happen

Have you ever watched a stock chart move sideways for weeks, then suddenly the price explodes 20% in just a few days? Big moves like this rarely happen without warning. There is one technical pattern that can help you spot price explosions before they happen: the Bollinger Band Squeeze.
The concept is simple. When volatility drops to its lowest level, it is like a spring being compressed. The tighter the compression, the more powerful the explosion that follows. In this article, you will learn how to identify a squeeze on the chart, determine the direction of the breakout, and combine Bollinger Bands with other indicators for more precise entries.
What Is the Bollinger Band Squeeze?
The Bollinger Band Squeeze is a condition where the upper and lower Bollinger Bands contract tightly toward each other, signaling that market volatility has dropped to very low levels. According to Investopedia, the squeeze is one of the most important concepts in Bollinger Bands because it provides an early warning of a major price move.
The logic works like this: the market constantly alternates between high-volatility and low-volatility periods. After a period of wild price swings, the market enters a calm phase where price moves within a narrow range. This calm phase is the squeeze.
The key takeaway is that the squeeze itself does not tell you which direction price will move. It only tells you that a big move is coming. As noted by StockCharts, the squeeze is a setup, not a signal. You need to wait for the breakout to occur before making a decision.
Most traders miss big moves because they are not paying attention during quiet phases. They see a "boring" chart and move on to another stock. But traders who understand the squeeze know that the "boring" chart is actually the most exciting one, because it is storing energy for the next explosion.
How Bollinger Bands Work
Before diving deeper into the squeeze, you need to understand the basics of Bollinger Bands. The indicator was created by John Bollinger in the early 1980s. According to Investopedia, Bollinger Bands are used to measure market volatility and identify overbought or oversold conditions.
Bollinger Bands consist of three lines:
- Middle Band - A 20-period Simple Moving Average (SMA). This is the "backbone" of Bollinger Bands and represents the average price over the last 20 days.
- Upper Band - The 20 SMA plus 2 standard deviations. This line acts as dynamic resistance.
- Lower Band - The 20 SMA minus 2 standard deviations. This line acts as dynamic support.
Why 2 standard deviations? Statistically, approximately 95% of price data falls within this range. When price touches the upper or lower band, it is in an "extreme zone."
The most important feature of Bollinger Bands is that the bands change width. When the market is volatile, the bands widen. When the market is calm, the bands narrow. This change in bandwidth is the foundation of the squeeze concept. For a step-by-step guide on setting up Bollinger Bands on TradingView, read How to Use Bollinger Bands on TradingView.
Anatomy of a Squeeze: From Compression to Explosion
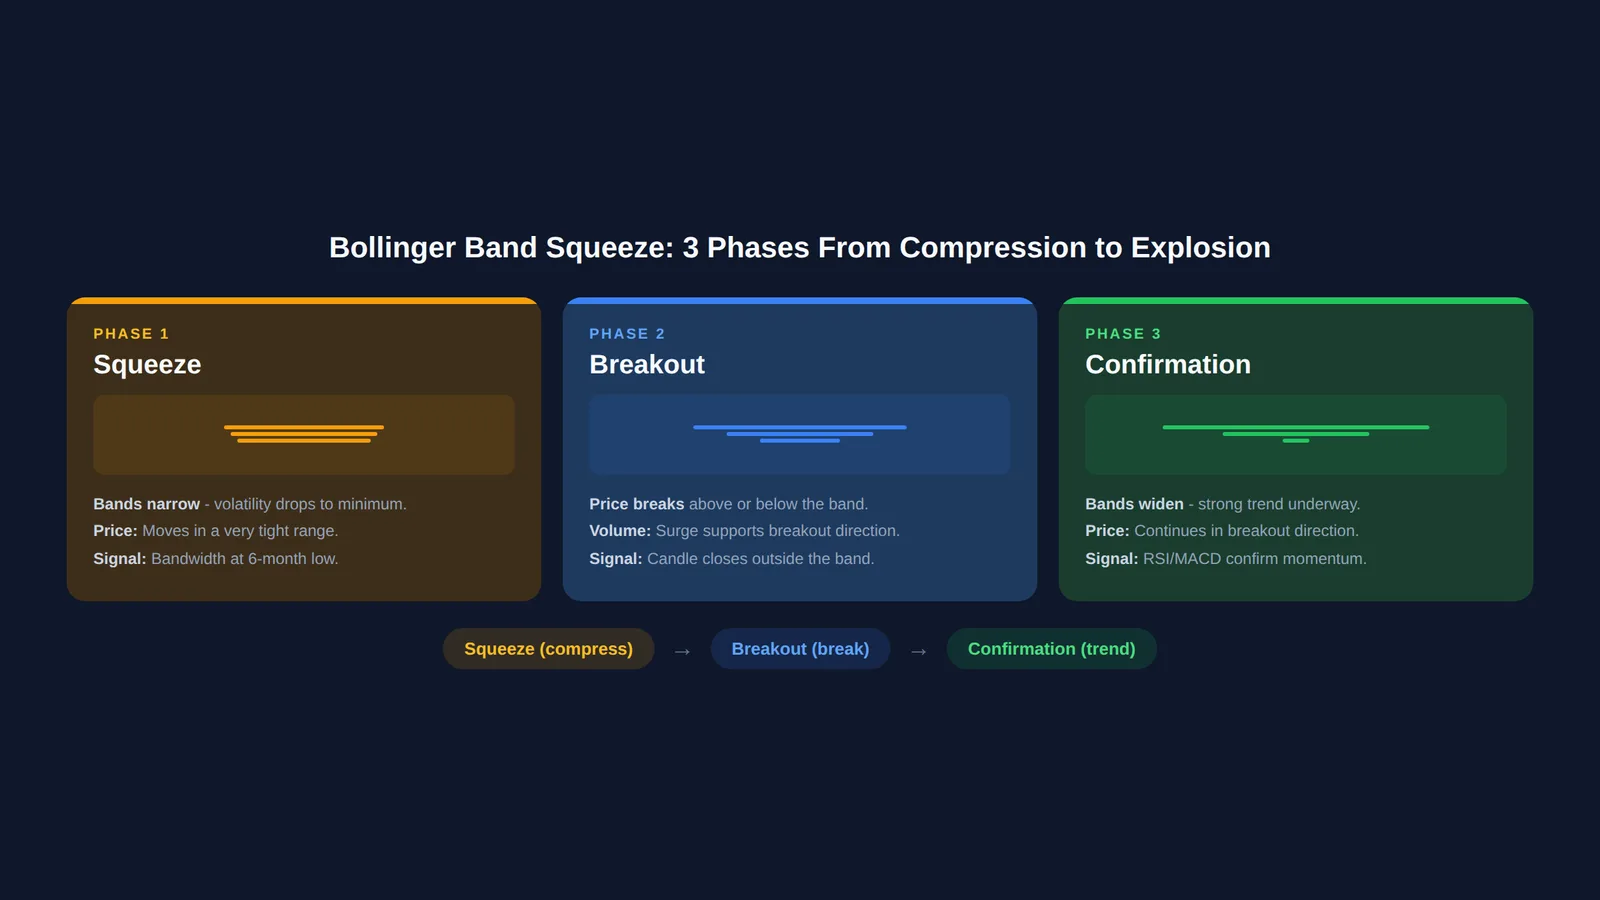
Every successful squeeze goes through three distinct phases. Understanding these phases helps you know where you are in the cycle and what action to take.
Phase 1 - Compression (Squeeze)
This is the phase where the upper and lower Bollinger Bands move closer together. Price moves within a narrow range, usually sideways or making small waves with no clear direction.
Characteristics of the compression phase:
- Bollinger Bands are at their narrowest spacing in the past 6 months
- Small candlesticks with short bodies and short shadows
- Trading volume typically declines, reflecting reduced buyer and seller interest
- If you display the Bandwidth indicator, its reading will drop to the lowest level
This phase can last from a few days to several weeks. The longer the compression lasts, the greater the potential explosion that follows.
What should you do? Watch and prepare. Do not enter a position yet. The squeeze means "get ready," not "buy now." Without directional confirmation, you are just guessing.
Phase 2 - Breakout (Expansion)
This is the moment when price finally breaks out of the narrow range and the Bollinger Bands begin to widen rapidly. This phase often happens suddenly.
Characteristics of the breakout phase:
- A large candlestick closing outside the upper band (bullish) or the lower band (bearish)
- Bollinger Bands begin to widen rapidly after the tight period
- A significant surge in trading volume, showing the "power" behind the move
- Bandwidth rising sharply from its low reading
When price breaks above the upper band with strong volume, it often marks the start of a significant uptrend. Conversely, a break below the lower band with high volume signals a downtrend. But not every breakout is genuine. Sometimes price pierces the band briefly then returns inside the range. That is why you need the third phase.
Phase 3 - Confirmation
The final phase is confirmation. This is where you gain confidence that the breakout is genuine and not just a false breakout (fakeout).
Characteristics of strong confirmation:
- Price continues to move in the breakout direction over the following days
- Bollinger Bands keep widening, showing that volatility is increasing
- Volume remains high or increases, not just a single-day spike
- Price does not fall back below the middle line (SMA 20) for a bullish breakout, or does not rise above the middle line for a bearish breakout
When all three phases are complete (compression, breakout, and confirmation), you have a high-quality setup. Not every squeeze produces a massive explosion, but when it comes with all three phases, the probability of success is significantly higher.
How to Identify a Squeeze on the Chart
How do you practically identify a squeeze? Here are four steps:
Step 1: Visually Observe the Band Width
Scroll left on your chart and compare the current band width with the previous months. If the current bands appear to be at their narrowest in the past 6 months, you may be looking at a squeeze.
Step 2: Use the Bandwidth Indicator
For more objective confirmation, add the Bollinger Bandwidth indicator to your chart. Bandwidth measures the distance between the upper and lower bands as a percentage of the middle line:
Bandwidth = (Upper Band - Lower Band) / Middle Band x 100
When the Bandwidth reading drops to its lowest level in 6 months or 125 trading sessions, that is a strong squeeze signal. On TradingView, you can find this indicator by typing "Bollinger BandWidth."
Step 3: Mark the Lowest Bandwidth Level
Mark the lowest Bandwidth reading on your chart as a "warning line." Every time Bandwidth approaches this level in the future, you know a squeeze may be forming.
Step 4: Watch the Volume
During a squeeze, trading volume usually declines. Low volume confirms that the market is "resting" before the next big move. The combination of low Bandwidth and declining volume gives a very strong squeeze signal. According to BollingerBands.com, John Bollinger's official website, the squeeze often precedes significant price movements.
Upside Squeeze vs Downside Squeeze
A squeeze is forming, but which direction will the price explode? The Bollinger Band Squeeze itself does not tell you the direction. Here are the factors that help:
1. Price Position Relative to the Middle Line (SMA 20)
If price consistently stays above the middle line during the compression phase, buyers are still dominant, and the probability of an upside breakout is higher. Conversely, price that frequently stays below the middle line increases the probability of a downside breakout.
2. Prior Trend
A squeeze following a strong uptrend is usually an accumulation phase before price continues higher. A squeeze following a downtrend is usually a distribution phase before price falls further.
3. Volume During the Breakout
This is the most critical clue. When price breaks above the upper band with volume far exceeding the average, it confirms genuine buying interest. A breakout without volume support often fails.
4. Breakout Candlestick
A large bullish candlestick (long body, short shadows) closing near its high gives strong conviction. A small candlestick or doji that merely "peeks" outside the band is not convincing enough. If you are new to these terms, read our guide on Technical Analysis Overview.
5. Middle Line Confirmation After the Breakout
Wait for a pullback after the initial breakout. If price breaks above the upper band, then pulls back to the middle line (SMA 20) and bounces up, that is a high-quality entry point with a better risk-reward ratio.
Bollinger Squeeze Examples on Bursa Malaysia
The squeeze concept works across various sectors and company sizes on Bursa Malaysia. Here are some examples:
Semiconductor and Technology Stocks
Counters like Inari Amertron and Frontken Corporation often display clear squeezes. Technology stocks go through pronounced volatility cycles, with prices bouncing on positive news before entering quiet phases. These quiet phases frequently form squeezes before the next big move.
Construction and Infrastructure Stocks
Gamuda and Sunway often form squeezes ahead of major contract announcements or government budget releases. When the market awaits mega tender decisions like MRT3, price moves sideways in a tight range before exploding once the news drops.
Glove Stocks
Top Glove and Hartalega have shown classic squeezes before major price explosions. The Bollinger Bands narrowed to their tightest levels for weeks, and when demand surged, prices exploded on extraordinarily high volume.
Blue Chip Stocks
Stocks like Maybank, CIMB, Tenaga Nasional, and Petronas Chemicals also go through squeeze phases. Their price explosions may not be as dramatic as smaller stocks, but they tend to be more "reliable" because they are supported by institutional fund flows. Press Metal Aluminium also frequently shows similar patterns ahead of quarterly earnings announcements.
The same pattern exists in every case: the compression phase occurs before a catalyst event. The squeeze tells you the market is "waiting" for something. Your job is to be ready when that catalyst arrives.
Common Mistakes With Bollinger Bands
Many traders make avoidable mistakes with Bollinger Bands:
1. Entering Too Early During the Squeeze
You see the bands narrowing and immediately buy. The problem is that the squeeze can last for weeks longer. Your capital is locked in a position that is not moving. Solution: wait for the breakout to happen first. The squeeze is a setup, not an entry signal.
2. Not Waiting for Confirmation
One candlestick pierces the upper band and you immediately buy. The problem is that many breakouts fail, with price returning inside the range the next day (fakeout). Solution: wait one to two days after the breakout and confirm with high volume.
3. Ignoring the Larger Trend
A squeeze within a larger bearish trend has a high probability of exploding to the downside. Always check the trend on the weekly or monthly timeframe before acting. A bullish squeeze is most effective when the larger trend is also bullish.
4. Treating Upper Band Touches as Sell Signals
In a strong uptrend, price can "walk the band" along the upper band for weeks. Selling just because price touches the upper band can cause you to miss significant gains.
5. Using Bollinger Bands in Isolation
A single indicator often produces false signals. Bollinger Bands are most effective when combined with other indicators.
Bollinger + Other Indicators: Stronger Setups
To improve the accuracy of squeeze signals, combine Bollinger Bands with other indicators that provide different perspectives. Here are the three most effective combinations:
1. Bollinger Bands + RSI (Relative Strength Index)
RSI measures price momentum strength on a scale from 0 to 100. This combination is highly useful because RSI helps you determine the breakout direction.
- During a squeeze, if RSI is above 50 and trending upward, the probability of an upside breakout is higher
- If RSI shows a bullish divergence during the squeeze (price moves sideways but RSI trends upward), this is a very strong signal that an upside explosion is coming
- Conversely, RSI below 50 and declining suggests a higher probability of a downside explosion
Ideal setup: Bollinger squeeze + RSI crossing above 50 + upper band breakout with high volume.
2. Bollinger Bands + Volume
A breakout without volume is like a gun without bullets: it looks threatening but has no real power.
- During a squeeze, volume should gradually decline, indicating the market is in a "waiting" phase
- When the breakout occurs, volume needs to surge at least 1.5 to 2 times the 20-day average volume
- Volume that remains high in the following days confirms that the breakout is genuine and not just noise
Remember: dry volume during the squeeze, then volume surges during the breakout. This is the classic pattern that confirms a high-quality squeeze setup.
3. Bollinger Bands + MACD
MACD (Moving Average Convergence Divergence) measures momentum and trend direction. This combination helps you confirm the strength of the breakout. For a deeper understanding of how to combine multiple technical indicators, read 3 Indicators, 1 System: How to Combine Fibonacci, MACD & Ichimoku.
- During a squeeze, the MACD histogram usually shrinks and flattens, indicating weakening momentum
- When price breaks above the upper band, a MACD bullish crossover (MACD line crossing above the signal line) provides very strong additional confirmation
- A MACD histogram that starts expanding after the breakout confirms that momentum is building
Ideal setup: Bollinger squeeze + MACD bullish crossover + expanding histogram + volume surge. According to Charles Schwab, combining two or three indicators that give aligned signals is a more disciplined approach that reduces the risk of entering on false signals.
FAQ
What is the Bollinger Band Squeeze in simple terms?
The Bollinger Band Squeeze occurs when the upper and lower Bollinger Bands contract tightly together, signaling low volatility. It is like a compressed spring: when the pressure is released, price tends to make a big move either up or down.
How long does a squeeze typically last?
There is no fixed duration. A squeeze can last from a few days to several weeks. On blue chip counters on Bursa Malaysia, squeezes often last 2 to 4 weeks. On smaller, more volatile counters, it may only be 5 to 10 days. The longer the squeeze lasts, the greater the potential explosion.
Does a squeeze always produce a big price explosion?
No. Not every squeeze results in a significant explosion. Sometimes the bands narrow and then price only moves slightly before going sideways again. That is why you need to wait for confirmation, a breakout with high volume, before making an entry decision.
How can I tell the direction of the explosion, up or down?
Use additional clues: the position of price relative to the SMA 20 middle line, the trend on a larger timeframe, RSI readings, and the MACD direction. A break above the upper band with high volume signals an upside explosion, while a break below the lower band with high volume signals a downside explosion.
What is the best Bollinger Bands setting for Bursa Malaysia?
The default settings (SMA 20, 2 standard deviations) work well for most counters on Bursa Malaysia on the daily timeframe. Some swing traders use SMA 10 with 1.5 standard deviations for more sensitive signals, but this produces more false signals.
Can I use the Bollinger Band Squeeze on penny stocks?
Technically yes, but exercise caution. Penny stocks often have low liquidity and are susceptible to manipulation. A squeeze may form simply because nobody is buying or selling, not because of natural accumulation. Focus on counters with sufficient liquidity.
What is the difference between a Bollinger Squeeze and a regular breakout?
A regular breakout happens when price breaks through a static support or resistance level. The Bollinger Squeeze refers to a breakout after a period of very low volatility. You know the price is breaking out after "energy" has accumulated, not just breaking an ordinary level.
Can the Bollinger Band Squeeze be used for forex and crypto?
Yes, the squeeze concept works for all markets: stocks, forex, crypto, commodities, and indices. The principle is the same: low volatility followed by high volatility. Only the parameters and timeframes need to be adjusted for each market.
Conclusion
The Bollinger Band Squeeze is a valuable technical setup because it gives you early warning of a major price move. The key is discipline: identify the squeeze, wait for the breakout, confirm with volume and other indicators, then enter the position.
No indicator is perfect, but the Bollinger Band Squeeze combined with volume analysis and momentum indicators becomes a powerful tool for investors and traders on Bursa Malaysia.
Practice your Bollinger Band reading skills with 40 real Bursa Malaysia charts on the Mahersaham Chart Game. Free to try.
Open an M+ CDS account to start investing on Bursa Malaysia as well as international markets including the US and Hong Kong.
Download our free Stock Basics Ebook to build a solid investing foundation.