How to Use Chart Patterns in Stock Analysis
What Are Chart Patterns
If you still remember, in the previous article I explained about how to use candlestick analysis.
This time I would like to explain how to use chart pattern analysis.
You are quite fortunate to be reading this article because even in the Supertrader class, we do not cover this topic in detail.
This time, Tuan Maher, a remisier at Mplus and founder of Mahersaham, is generous enough to share in depth about today's topic.
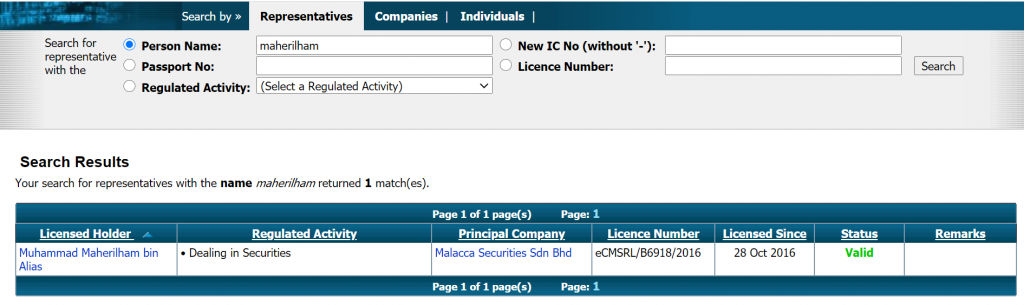
Proof that Tuan Maher is a registered remisier
A chart pattern is a pattern that forms on a chart when lines are drawn.
It is used by traders to know where the stock price is heading.
Whether the stock price will go up or down.
Besides that, it helps us to plan our trading plan.
There are several types of chart patterns, including:
- Traditional chart pattern
- Harmonic pattern
- Candlestick pattern
This article will focus on traditional chart patterns.
Importance of Chart Patterns
1. Risk Management
The important thing for us to know is: when does a pattern complete?
So when exactly?
A chart pattern completes when a breakout occurs.
The pattern will break either upwards or downwards.
So what is the connection with risk management?
Risk management is precisely at the end of the chart pattern during breakout.
Once we know what chart pattern has formed, we can determine our entry price (EP), target price (TP), and cut loss (CL) levels.
2. Easy to Remember
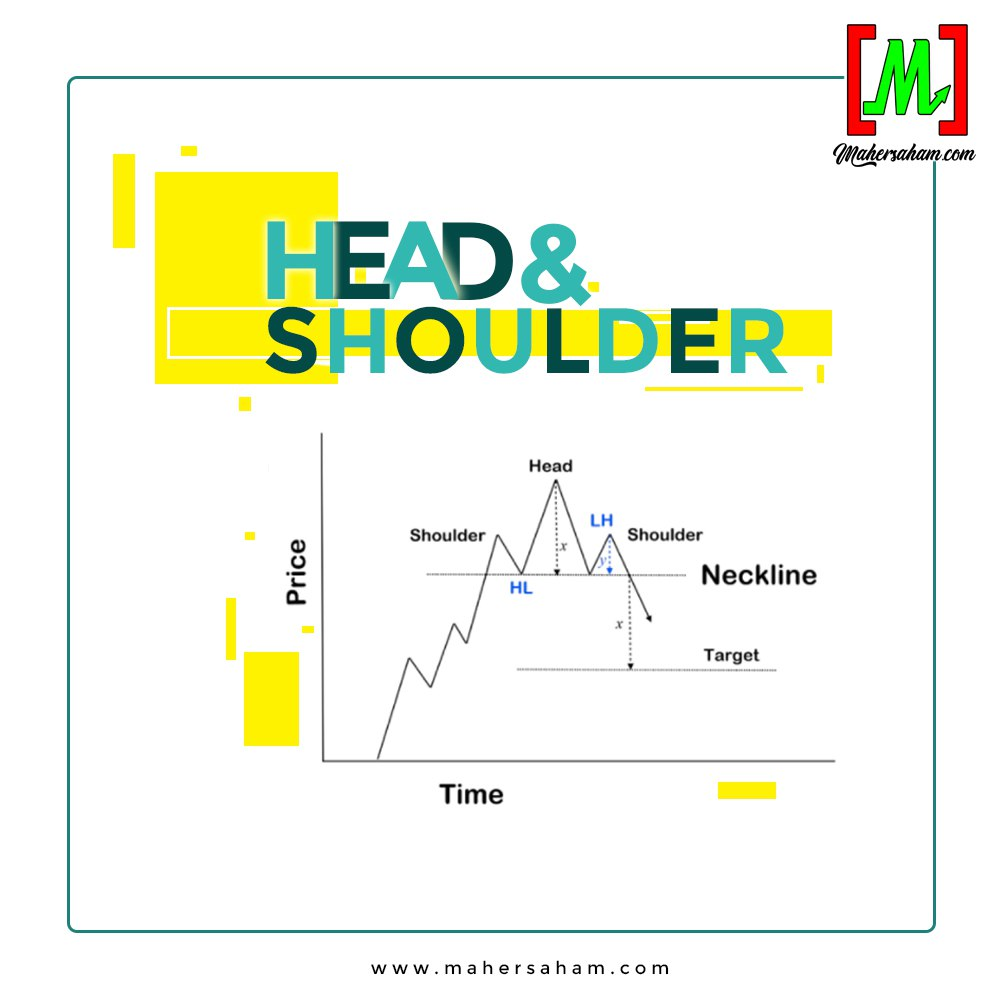
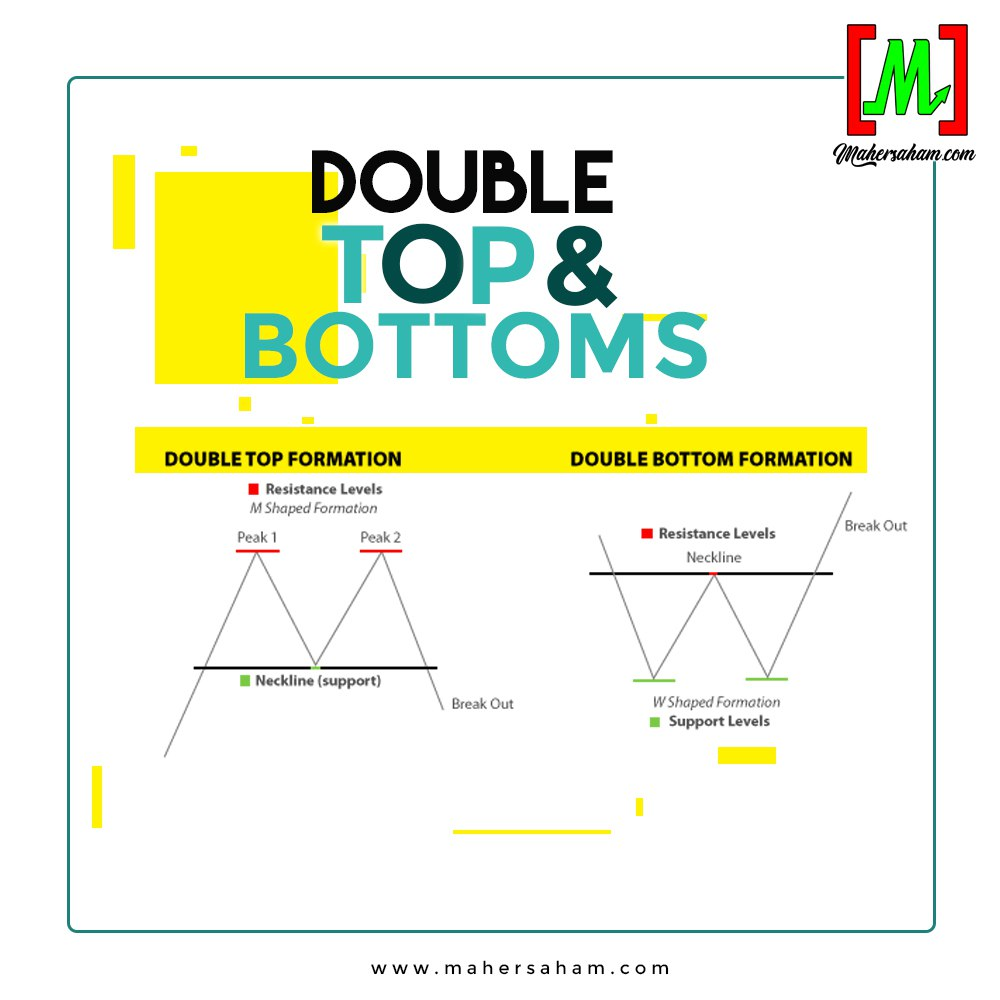
They are very easy to remember because the name of the chart pattern matches the shape or pattern that is formed.
Among them:
- Head & shoulder
- Double bottom
- Cup & handle
3. Forecasting Method
If you only use indicators alone, whether it is the Relative Strength Index, MACD, or any other, you will not be able to tell how far a stock price can drop or rise.
The reason is that indicators are lagging.
Lagging means the analysis is based on stock price movements that have already occurred. From there, an indicator is generated.
Unlike chart patterns, they can serve as a forecasting method (prediction).
In forecasting, apart from chart patterns, there are also other methods such as Fibonacci, Elliott wave, volume price analysis, and many more.
Basic Chart Pattern
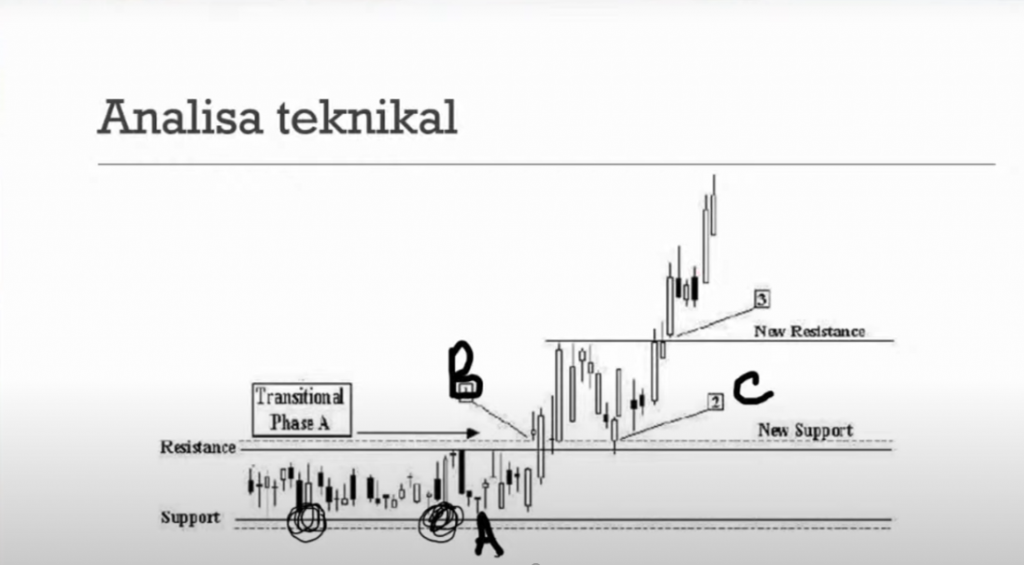
Based on the diagram above, starting from point A, the price moves sideways, then at point B a breakout occurs.
Next, a pullback occurs at point C and then the stock price rises again.
Before you buy a stock, identify where points A, B, and C are.
Do you know at which point we should potentially buy?
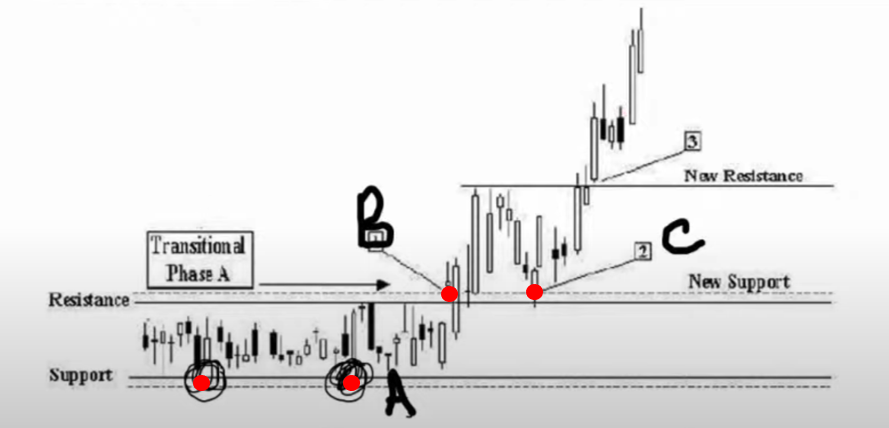
At the red point is where traders would potentially buy.
Simply put, the A, B, and C pattern is the standard pattern for us to understand.
Types of Chart Patterns
1. Reversal
Typically, reversal patterns appear at the end of a trend.
If it was previously an uptrend and you spot a reversal pattern, once it completes and breaks out downwards, the pattern will change to a downtrend.
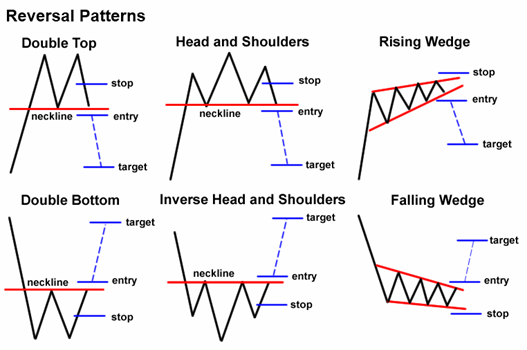
Similarly, when in a downtrend and you spot a reversal pattern, once it completes and breaks out upwards, the pattern will change to an uptrend.
2. Continuation
If the previous pattern was a downtrend and then a breakout occurs, the trend will continue downwards and carry on the downtrend.
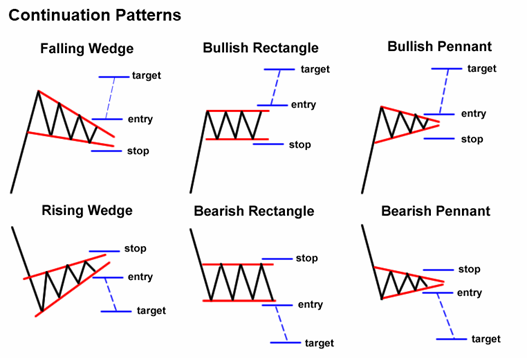
Conversely, if the previous pattern was an uptrend and then a breakout occurs, the trend will go upwards and continue the uptrend.
3. Bilateral
A pattern that is uncertain -- it can go upwards (uptrend) or downwards (downtrend).
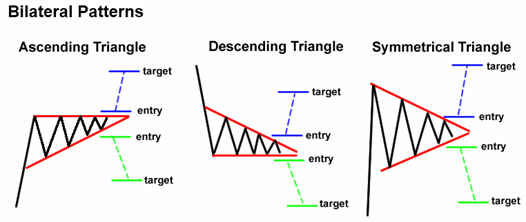
If you noticed in the diagrams for each type of pattern, there are reference points for you to set your target (target price), entry (entry price), and stop (cut loss).
I hope you understand, and if you have any questions, do not hesitate to ask the Mahersaham team.
Frequently Asked Questions (FAQ)
What are chart patterns and why are they important in technical analysis?
A chart pattern is a price formation that appears on a stock chart, used by investors to predict subsequent price movements. It is important because chart patterns help investors identify optimal entry and exit opportunities based on recurring historical price movements.
What is the difference between reversal patterns and continuation patterns?
A reversal pattern signals a change in the current trend direction, for example from an uptrend to a downtrend or vice versa. Meanwhile, a continuation pattern indicates the current trend will persist after a period of consolidation. Understanding this difference helps investors make more accurate decisions.
How do you set target price and cut loss using chart patterns?
Each chart pattern has its own guidelines for target price and cut loss. Generally, the target price is calculated based on the height of the pattern added to or subtracted from the breakout point. Cut loss is placed below the support level of the pattern to minimise the risk of loss.
Can chart patterns be used together with other technical indicators?
Yes, chart patterns are more effective when combined with other technical indicators such as candlestick patterns, volume, and moving averages. This combination provides stronger confirmation before making buy or sell decisions on Bursa Malaysia stocks.
Start your investment journey by opening a CDS account through Mahersaham for access to exclusive investor classes.
Get our free stock basics ebook to learn the fundamentals of stock investing from scratch.
Further reading: