How to Draw a Channel & Trading Strategy Using It

In this article, we will continue learning on TradingView about how to draw a channel and the strategy for using it in stock trading.
Have you not yet learnt about the Bollinger Band indicator on TradingView? Click here to learn about this indicator.
Ready?
Let us prepare our notebook and pen to start learning.
You can open your TradingView.
Drawing a Channel
What is a channel?
A channel is basically what we draw using the trendline tool in TradingView.
By using the trendline, we can draw a line and simply connect bottom to bottom.
When we see the stock price bouncing off a line, we can turn it into a trendline.
If the trendline points upwards, it means the stock is in an uptrend, whereas if it points downwards, it is in a downtrend.
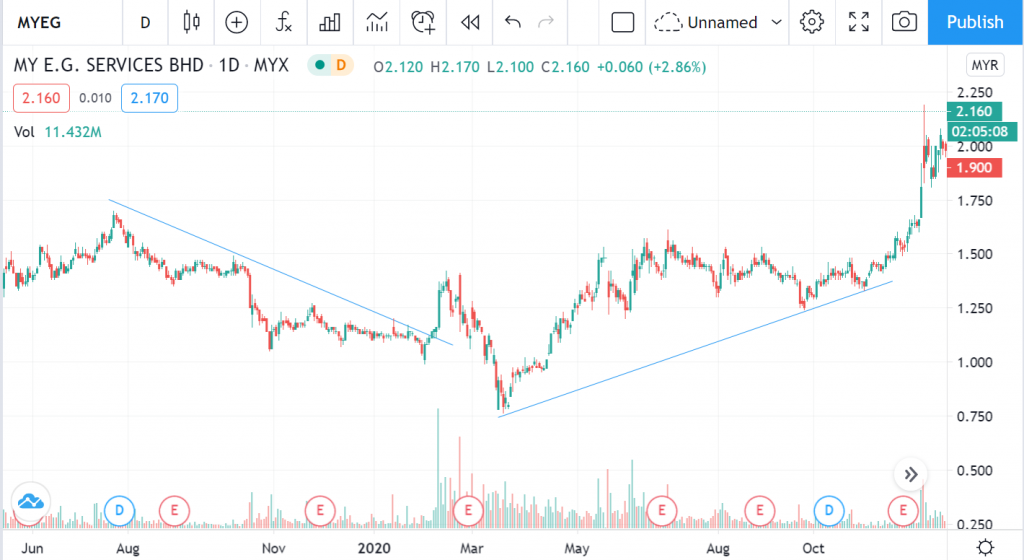
Look at the image above — I have plotted lines connecting peak to peak and bottom to bottom.
A channel has 2 lines: an upper line and a lower line.
You can try drawing it yourself.
In TradingView, you can use the trendline tool to draw another line at the top, which is called the upper channel.
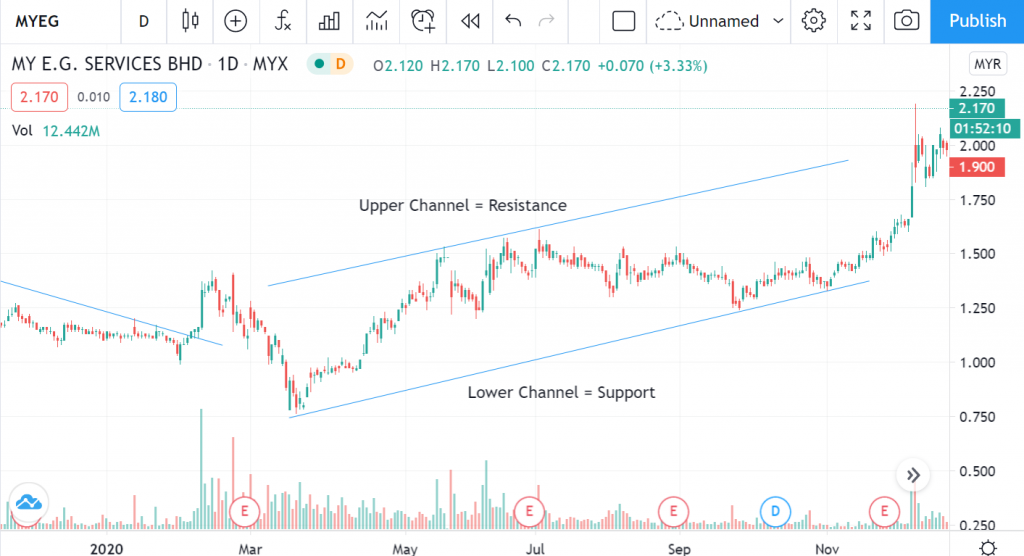
Please refer to the image provided. I have labelled where the upper channel and lower channel are.
Upper Channel = Resistance
Lower Channel = Support
The upper channel acts as resistance, so when the price reaches the resistance level, it will bounce back downwards.
And the lower channel acts as support.
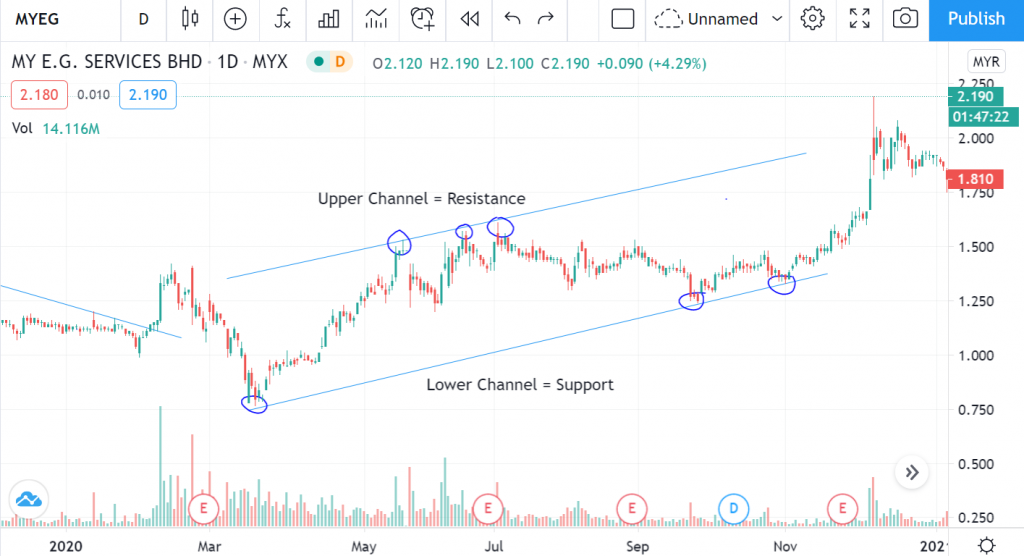
Based on the image above, you can see the price has tested the upper channel and lower channel lines at the points I have circled.
For a channel to be valid, the price needs to test at least 2 points, but ideally 3.
This is because we need 2 points to form a channel.
If there are already 3 points, it means our channel is strong and reliable.
Parallel Channel
Earlier, we used the trendline tool. The second method is to draw a channel using the parallel channel tool.
No need to draw two separate lines.
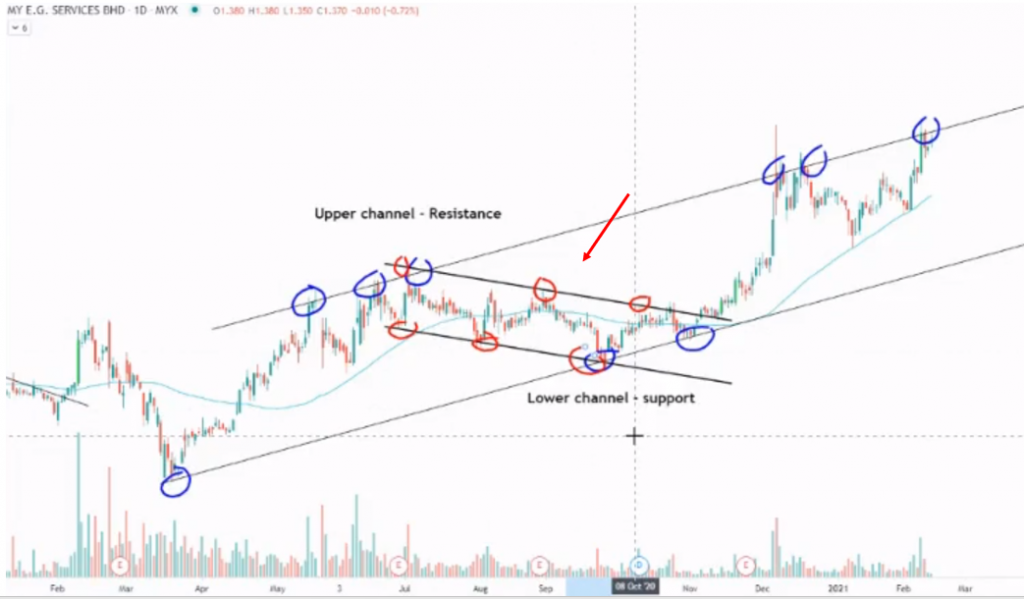
By using the parallel channel tool, you can draw two lines just like we did with the trendline earlier. The lines will automatically be parallel.
So we can see how many points the stock price has tested.
If there are 3 points, then your channel is valid.
Do not worry if the price slightly exceeds the channel lines — that is normal as it could be an oversold or overbought condition.
Done!
Conclusion
In conclusion, it is quite easy to draw a channel. You just need to have a sharp eye and be observant to spot whether the price has reached or not yet reached the upper channel and lower channel.
What happens at the channel is that it tells us where the strongest battle between buyers and sellers will take place.
If the sellers are stronger, the price will bounce downwards, and if the buyers are stronger, the price will bounce upwards.
Usually, at these channel levels is where you need to make a decision — whether to buy or sell the stock.
If you want to buy shares, buy when the price is close to support — do not buy far from support — and sell when the price is near resistance. That is the strategy.
Do not worry! Watch the video below for a better understanding.
Frequently Asked Questions (FAQ)
1. What is a channel in stock technical analysis?
A channel is a chart pattern that forms when a stock price moves between two parallel lines — the support line below and the resistance line above. It helps traders identify the direction of the trend.
2. How do you correctly draw a channel on TradingView?
Select the Parallel Channel tool on TradingView, then draw the first trendline by connecting at least two swing low or swing high points. The second line will form automatically in parallel.
3. What is the trading strategy using channels?
The basic strategy is to buy when the price touches the channel support line and sell when the price approaches the channel resistance line. A breakout from the channel can also signal a trend change.
4. Can channels be used for all types of stocks?
Yes, channels can be used for any stock counter on Bursa Malaysia or international markets. They are effective for stocks that have a clear trend, whether uptrend, downtrend, or sideways.
Want to start investing in stocks? Open a CDS account with Mahersaham today. Download the free stock basics ebook for a complete guide!