How to Use Exponential Moving Average (EMA) in TradingView

Assalamualaikum and greetings to all loyal readers of the Mahersaham blog.
How are you? Hopefully you are all well and healthy alongside your beloved families.
Have you read the article on How to Register a TradingView Account and Create a Template?
After reading that, make sure you create a TradingView account straight away.
That way you can practise the technical analysis that Mahersaham teaches live on Facebook and also on Youtube.
For those who already have a TradingView account,
go ahead and open your account — let us learn how to use the Exponential Moving Average in TradingView.
What Is the Exponential Moving Average Indicator?
The Exponential Moving Average (EMA) is a type of moving average (MA) that places greater weight and significance on the most recent data.
Today''s and yesterday''s data are the most important,
compared to prices from earlier periods.
The EMA calculation formula is:
= Price(t) x k + EMA(y) x (1 - k)
where: t = today, y = yesterday, N = number of days in EMA, k = 2 / (N+1)
Do you need to memorise this formula?
No, you do not.
It is simply for your knowledge on how the Exponential Moving Average is calculated.
Exponential Moving Average Indicator in TradingView
After logging in to TradingView, click on the chart section.
You will then see the display shown below.
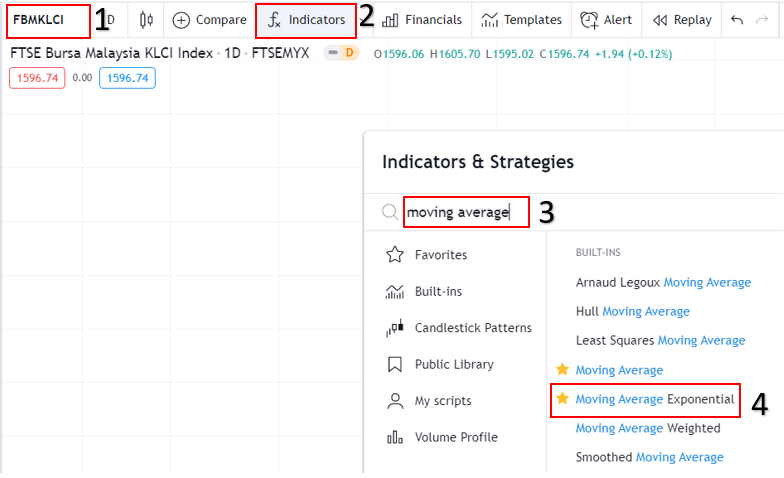
As shown in the image above, you can follow these steps:
- 1. Enter the name of the stock counter you wish to analyse.
- 2. Click the indicator button.
- 3. Type the indicator you want to use (exponential moving average for this time).
- 4. Click on that indicator.
After that, your TradingView will look like this.
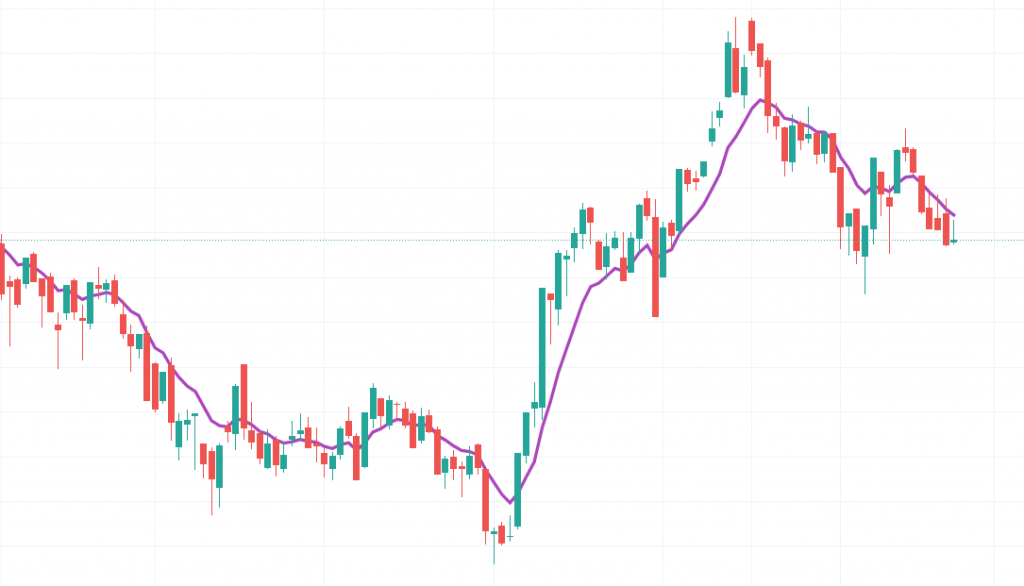
The purple line is the Exponential Moving Average (EMA) indicator.
It is up to you which EMA period you want to use.
If you are using EMA for the first time,
the default setting is EMA9.
The EMA indicator is similar to the MA.
The purpose of EMA is the same — we want to observe the trend of a particular stock.
Have you ever wondered what the difference is between MA and EMA?
Let us compare them on a chart.
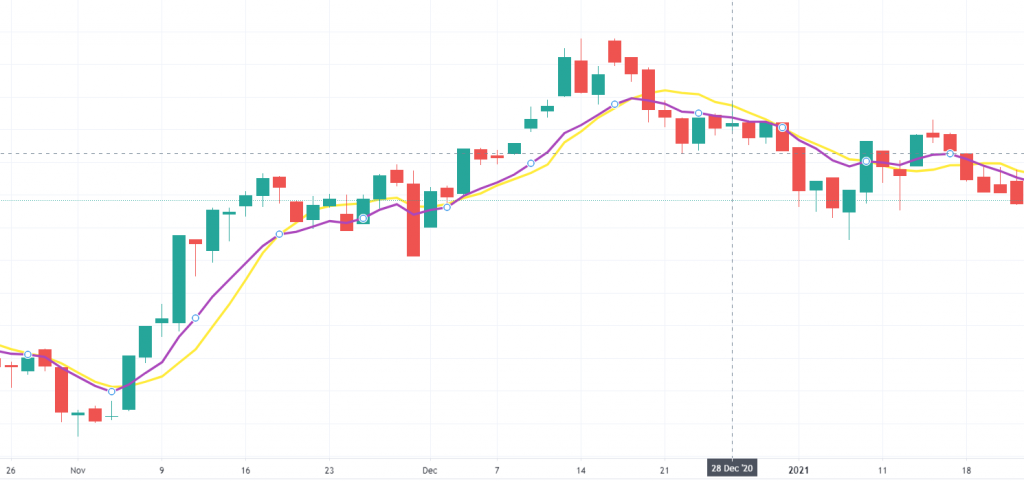
The purple line is the EMA.
The yellow line is the MA.
What can you analyse from this?
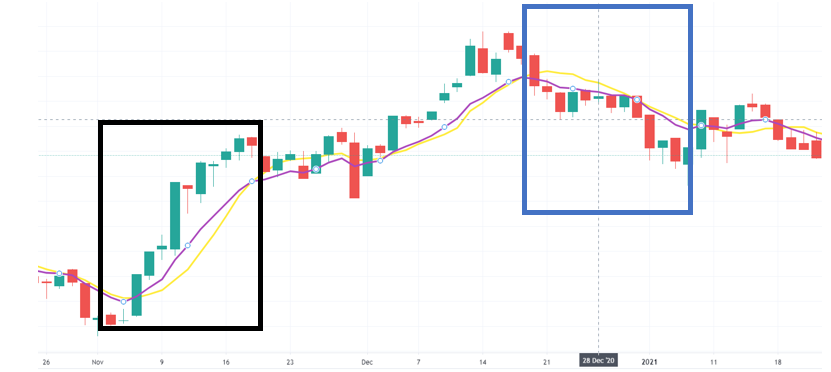
Alright, let us analyse them one by one.
Take a look at the black box in the image above.
When the stock price is rising, the EMA reacts first to the situation compared to the MA.
The same applies when the stock price is declining.
Now look at the blue box.
The EMA indicator reacts first to the situation compared to the MA.
What does react mean here?
React here means it responds by indicating the rise and fall of a stock''s price.
EMA is more responsive and reacts more quickly.
However, EMA also has its weaknesses.
Because EMA is overly responsive, it can sometimes give false alarms.
The key highlight for both MA and EMA is that we want to identify the market direction.
If the price is above the EMA,
it indicates an uptrend.
However, if the price is too far from the indicator (MA or EMA),
that is something we need to be cautious about.
If the price is below the EMA, it indicates a downtrend.
TradingView Is an Essential Component of Technical Analysis
This article is one of the articles written in the Technical Analysis: TradingView series. Technical Analysis is one of the branches related to stock research.
There are many more topics covered in the technical analysis learning series and how you can use TradingView optimally to help you conduct stock research.
To view other topics related to TradingView or Technical Analysis, head over to the Complete Guide to Technical Analysis.
Conclusion
EMA is generally more sensitive to price movements. It can help you identify trends earlier than the MA.
However, EMA may experience more short-term fluctuations compared to the MA.
Frequently Asked Questions (FAQ)
1. What is the difference between EMA and a regular MA?
EMA (Exponential Moving Average) gives more weight to the most recent prices compared to MA (Simple Moving Average) which gives equal weight to all prices within a given period. This makes EMA more sensitive to recent price changes.
2. What is the best EMA setting for stock trading?
Popular EMA settings include EMA 9, EMA 20 and EMA 50. EMA 9 is suitable for short-term trading, EMA 20 for swing trading, whilst EMA 50 and EMA 200 are used to identify long-term trends.
3. How do you read signals from the EMA?
When the price is above the EMA line, it indicates a bullish (upward) trend. Conversely, when the price is below the EMA, it indicates a bearish (downward) trend. A crossover between two EMAs can also provide buy or sell signals.
4. Can EMA be used together with other indicators?
Yes, EMA is often combined with other indicators such as MACD, RSI and Volume to obtain stronger signals. Combining several indicators helps to reduce false signals.
Ready to begin your stock investment journey? Open a CDS account with Mahersaham today and download the free stock ebook to learn from the basics!