Parabolic SAR Indicator Explained: Reading the Dots, Settings & Trailing Stops

Have you ever noticed the small dots that appear above or below the candlesticks on a stock chart? Those dots are not decoration. They are the Parabolic SAR, one of the most popular technical indicators for identifying trend direction and spotting when a trend may be about to reverse. Many Malaysian traders use this indicator every day without truly understanding how it works, when it can be trusted, and when it will mislead you.
Quick answer: The Parabolic SAR (Stop and Reverse) is a trend-following indicator that plots a series of dots on the chart - dots below the price signal an uptrend (buy/hold), while dots above the price signal a downtrend (sell/stay out). When the dots "flip" from one side to the other, it signals that the trend may have changed direction.
In this article, we will break down how to read the Parabolic SAR correctly, its formula and default settings, how to use it as a trailing stop loss, its biggest weakness in sideways markets, and how to combine it with other indicators for more reliable results.
What Is the Parabolic SAR?
SAR stands for Stop and Reverse. The name itself explains its original purpose: the indicator was designed to tell traders where the "stop" level sits for the current position, and at what level that position should be "reversed" in the opposite direction.
According to Investopedia, traders use the Parabolic SAR to determine trend direction and identify potential price reversals. It belongs to the lagging, trend-following family of indicators - meaning it follows price action that has already happened rather than predicting moves that have not happened yet.
It is called "parabolic" because the dots curve like a parabola as the trend strengthens. The longer a trend runs, the faster the SAR dots chase the price - a mechanism designed specifically to stop traders from sitting too long in a trend that has already lost momentum.
If you are still new to terms like trend, reversal and indicator, we recommend starting with our guide to 22 essential technical analysis terms.
Who Created This Indicator?
The Parabolic SAR was created by J. Welles Wilder Jr., an American mechanical engineer who switched careers to become a technical analyst. He introduced the indicator in his classic book New Concepts in Technical Trading Systems (1978).
Remarkably, the same book also introduced several other indicators still in use today - the RSI (Relative Strength Index), ATR (Average True Range) and ADX (Average Directional Index). Wilder is arguably one of the most influential figures in modern technical analysis, and nearly every trading platform today still ships his work as default indicators.
How to Read the Parabolic SAR Dots
The basic reading is very simple, which is exactly why it is so popular with new traders:
- Dots BELOW the price - the market is in an uptrend. Signal to buy or hold your position.
- Dots ABOVE the price - the market is in a downtrend. Signal to sell or avoid long positions.
- Dots flipping sides - a potential trend reversal. The first dot that jumps to the opposite side is an early signal that the trend may have ended.
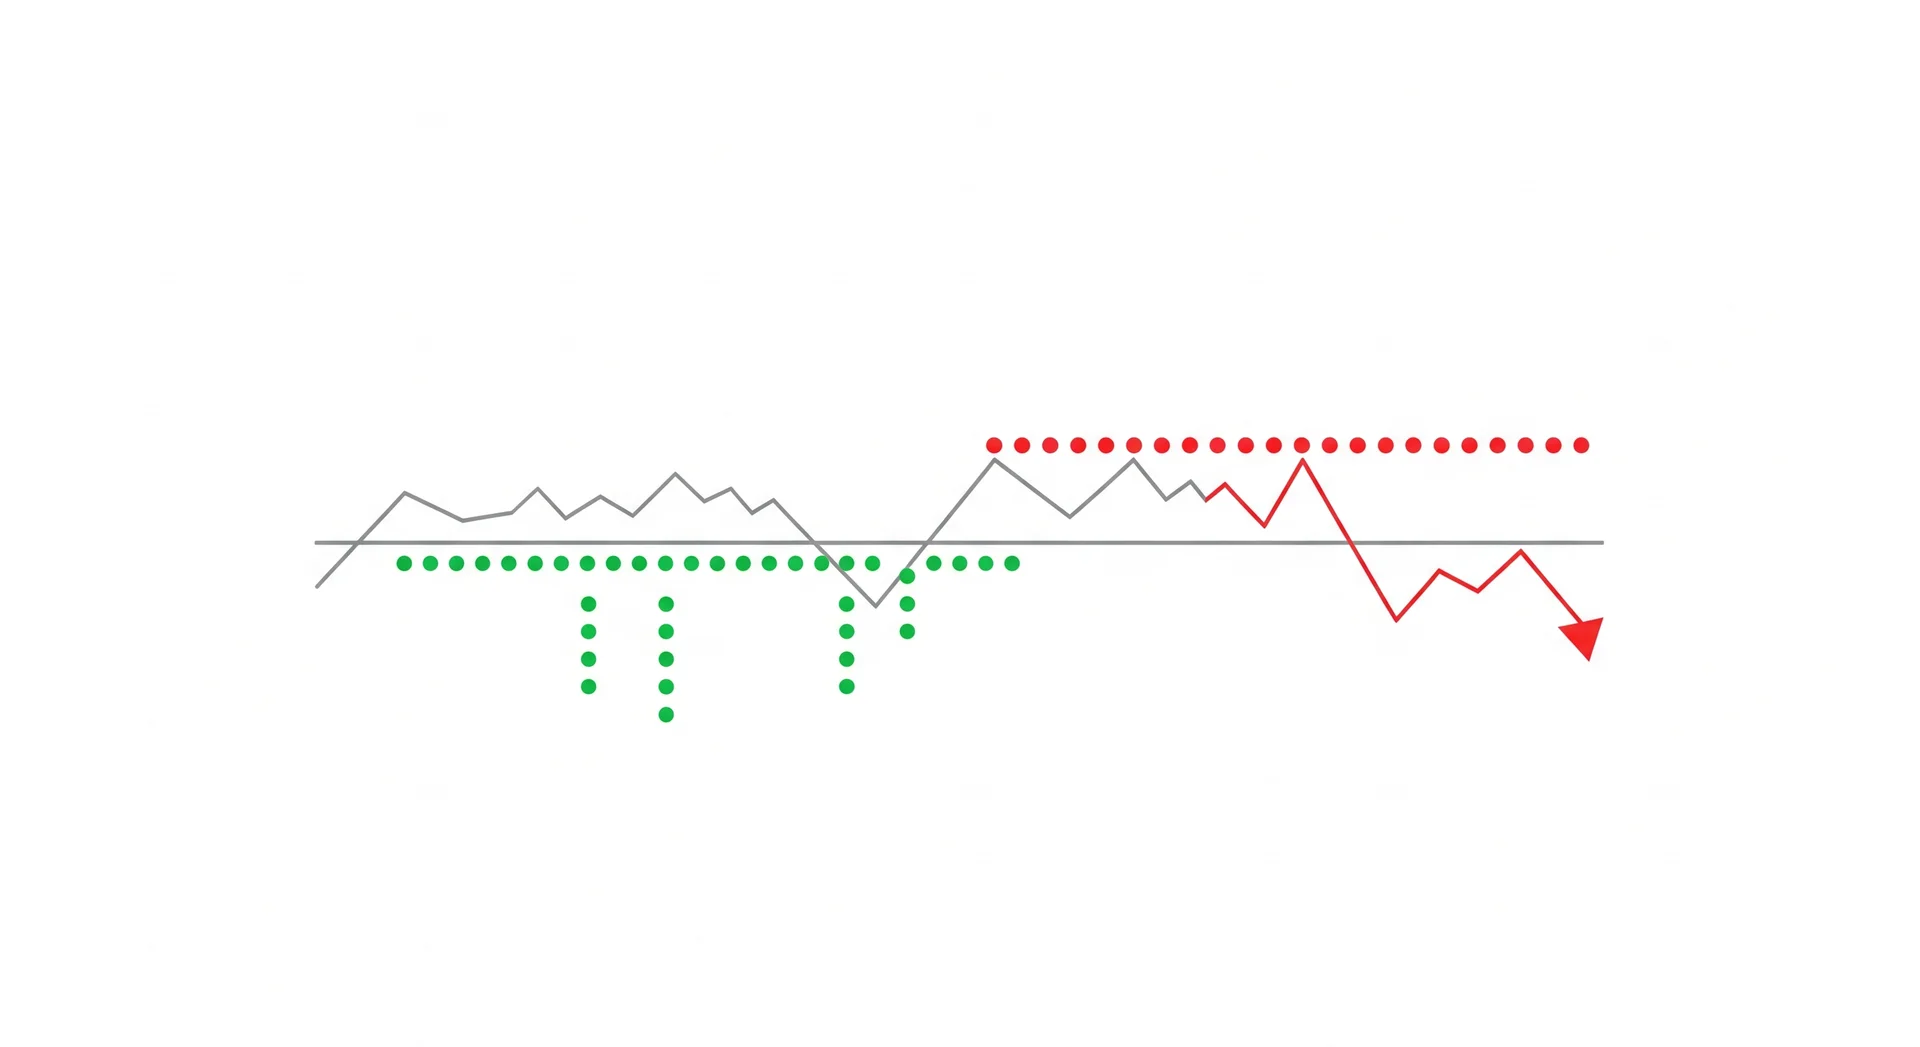
Note that SAR dots are always present on the chart - the indicator never says "no signal". This is both its strength and its weakness. In a clearly trending market, the flip signal is very useful. But in a sideways market, the dots keep jumping up and down, producing a string of false signals (whipsaws).
To understand the price action behind these dots, a solid grasp of candlestick anatomy helps a lot - because the SAR is calculated from each candle's high and low.
Formula & Default Settings
You never need to calculate the SAR manually - every platform does it automatically. But understanding the formula helps you understand why the indicator behaves the way it does. According to StockCharts ChartSchool, the core formula is:
Tomorrow's SAR = Today's SAR + AF × (EP - Today's SAR)
The three key components:
- EP (Extreme Point) - the highest price of the current uptrend, or the lowest price of the current downtrend.
- AF (Acceleration Factor) - starts at 0.02 and increases by 0.02 each time a new EP is recorded.
- Maximum AF - capped at 0.20 so the dots do not chase the price too aggressively.
The default 0.02, 0.20 settings are used by virtually every platform, including TradingView, Bursa Anywhere and M+ Online. In practical terms: the longer a trend runs and the more "new records" it sets, the faster the SAR dots close in on the price. Strong trends get "protected" more tightly, and your profits are locked in earlier once momentum starts to fade.
Traders who want more sensitive signals can raise the starting AF (for example 0.03), while traders who want fewer false signals can lower it (for example 0.01). There is no absolute "best" setting - it depends on the timeframe and the volatility of the counter you trade.
A Quick Calculation Example
Suppose a counter is in an uptrend. Today's SAR sits at RM1.00, the highest price of the trend so far (EP) is RM1.20, and the current AF is 0.04. Then:
Tomorrow's SAR = 1.00 + 0.04 × (1.20 - 1.00) = RM1.008
The next day, if the price makes a new high at RM1.25, the EP updates to 1.25 and the AF rises to 0.06. The next calculation becomes 1.008 + 0.06 × (1.25 - 1.008), or roughly RM1.023. Notice how each new high accelerates the SAR dots - this is the "acceleration" mechanism that makes the indicator guard your profits more tightly as the trend matures.
Using the Parabolic SAR as a Trailing Stop Loss
This is actually the most valuable function of the Parabolic SAR, and ironically the least used by new traders. Most people use the SAR as an entry signal, when Wilder actually designed the indicator for managing exits.
The method is simple: as long as you hold a long position, treat the SAR dot below the price as your moving stop loss level (trailing stop). Each day the dot rises slightly, and your stop loss rises with it. You no longer need to guess when to exit - your exit discipline is set mechanically.
The advantages of this approach:
- Emotion is removed from the exit decision - no more "just wait a bit, it will surely bounce back".
- Profits are locked in progressively - the stronger the trend, the closer your stop trails the price.
- Ideal for swing traders - who cannot watch the chart all day.
If you practise swing trading, the SAR trailing stop technique is one of the most practical ways to let profits run while protecting your capital.
The Main Weakness: Sideways Markets
No indicator is perfect, and the Parabolic SAR's weakness is very clear: it only works well in trending markets. According to Babypips, this indicator should not be used when the price is moving sideways or in choppy conditions, because the dots will repeatedly flip up and down and generate consecutive false buy-sell signals.
Picture this scenario: a stock trades in a narrow range between RM1.00 and RM1.06 for a month. The Parabolic SAR will signal buy, then sell, then buy again - perhaps 8 to 10 times. If you follow every signal, you bleed brokerage fees repeatedly with nothing to show for it. This phenomenon is called a whipsaw, and it is the number one account killer for traders who use the SAR on its own.
Wilder himself was aware of this weakness. That is why he recommended pairing the Parabolic SAR with a trend-strength indicator such as the ADX - also his creation - to confirm the market is actually trending before acting on any SAR signal.
One more thing Bursa traders need to understand: the SAR does not protect you from gaps. If a counter opens far below the SAR dot after bad news (a terrible quarterly report, or the counter being designated), your exit executes at the much lower opening price, not at the SAR level itself. A mechanical trailing stop reduces risk, but never eliminates it entirely - which is why position sizing remains the most important layer of defence in your risk management.
Combining It With Other Indicators
To cut down on false signals, never use the Parabolic SAR alone. Here are the combinations experienced traders commonly use:
SAR + ADX
This is the original combination Wilder recommended. The ADX measures trend strength (not direction). The simple rule: only act on SAR signals when the ADX is above 25, indicating a trending market. If the ADX is below 20, ignore SAR signals because the market is most likely moving sideways.
SAR + Moving Average
Use a longer-term moving average (such as the MA50 or MA200) as a directional filter. Only take SAR buy signals when the price is above the MA - this ensures you trade with the larger trend instead of against the current.
SAR + RSI
Pair it with the RSI or Stochastic to avoid buying into overbought conditions. If the SAR flashes a buy signal but the RSI is already above 70, it is usually wiser to wait for a pullback than to chase the price.
How to Add the Parabolic SAR on TradingView
The steps are very straightforward:
- Open the chart of your chosen counter on TradingView.
- Click the Indicators button at the top of the chart.
- Type "Parabolic SAR" in the search box and select the indicator.
- The SAR dots will appear on the chart immediately. Click the gear icon to adjust the settings - the defaults are Start 0.02, Increment 0.02, Max Value 0.20.
According to the official TradingView documentation, you can also change the colour and size of the dots for clearer visuals. Local broker platforms such as M+ Online offer the same indicator in their chart menus with identical settings.
Practical Examples on Bursa Malaysia
Let us look at how Bursa traders can apply this indicator in real situations:
Scenario 1 - Riding an uptrend: A tech counter breaks resistance on high volume, and the SAR dots flip below the price. You enter at RM0.50. Every few days, the SAR dot rises: RM0.51, RM0.53, RM0.56. Three weeks later the price hits RM0.68 with the SAR dot at RM0.63. When the price breaks below RM0.63, you exit automatically with a 26% profit - without ever needing to guess the top.
Scenario 2 - Avoiding the whipsaw: A plantation counter drifts sideways between RM4.20 and RM4.35 for two months. The SAR flips 7 times during that period. A trader who checks the ADX (reading of 15, below the 20 threshold) knows there is no trend, so every SAR signal is ignored. Capital is saved from repeated transaction costs.
The lesson: the Parabolic SAR is a tool for riding trends, not for finding them. Finding the trend is a separate job for volume analysis, chart patterns and supporting indicators.
Frequently Asked Questions (FAQ)
What are the best settings for the Parabolic SAR?
The default settings of 0.02 (start), 0.02 (increment) and 0.20 (maximum) suit most situations and daily timeframes. Raise the AF for faster signals (but more false ones), or lower it for slower, more stable signals.
Is the Parabolic SAR suitable for beginners?
Yes, because it is extremely easy to read - dots below mean uptrend, dots above mean downtrend. But beginners must understand its weakness in sideways markets before relying on it for entries.
Can the Parabolic SAR be used on any timeframe?
Yes, from 5-minute charts up to weekly charts. However, lower timeframes produce more whipsaws. For Bursa Malaysia stocks, the daily chart is the most practical choice for swing traders.
What is the difference between the Parabolic SAR and a Moving Average?
Both are trend-following indicators, but the SAR is designed specifically to provide clear exit/stop levels, while the MA is better suited for identifying direction and dynamic support. The SAR closes in on the price far more aggressively than an MA.
Why do the SAR dots keep flipping up and down?
That is a sign the market is sideways or choppy. In these conditions, SAR signals cannot be trusted. Check trend strength with the ADX - if the reading is below 20, it is better to wait for a clear trend to form.
Can the Parabolic SAR be used for crypto and forex?
Yes, the same formula works for any asset with high/low price data, including crypto, forex, commodities and indices. Just remember that more volatile assets produce more flips.
Is the Parabolic SAR a leading or lagging indicator?
Lagging. It is calculated from price movements that have already happened, so its signals always arrive after a trend has started or ended. It does not predict the future - it confirms what is currently happening.
Conclusion
The Parabolic SAR is a simple yet powerful indicator - dots below the price signal an uptrend, dots above signal a downtrend, and a flip warns of a potential reversal. Its real strength is not as an entry signal, but as a mechanical trailing stop loss that strips emotion out of your exit decisions. Use it in trending markets, combine it with the ADX or a moving average, and avoid it in sideways conditions.
An indicator is only a tool - the final decision is always yours. The first step to putting all of this into practice is having access to the real market.
Don't have a trading account yet? Open a CDS account with us for access to Bursa Malaysia as well as foreign markets such as US and Hong Kong stocks.
Want to strengthen your foundations first? Download our Stock Market Basics Ebook for free.