RSI Beyond Overbought & Oversold: 3 Pro Techniques Every Trader Should Know

RSI - More Than Just 30 and 70
If you have ever studied technical analysis, RSI is probably one of the first indicators you came across. And chances are, you were taught the same thing as everyone else: buy when RSI is below 30, sell when RSI is above 70. Done.
But the truth is, that barely scratches the surface.
The Relative Strength Index (RSI) was created by J. Welles Wilder Jr. in 1978 in his book New Concepts in Technical Trading Systems. What most people do not know is that Wilder himself actually placed more emphasis on divergence and failure swing techniques rather than the standard overbought/oversold signals. In fact, in his original book, Wilder stated that divergence is the strongest RSI signal.
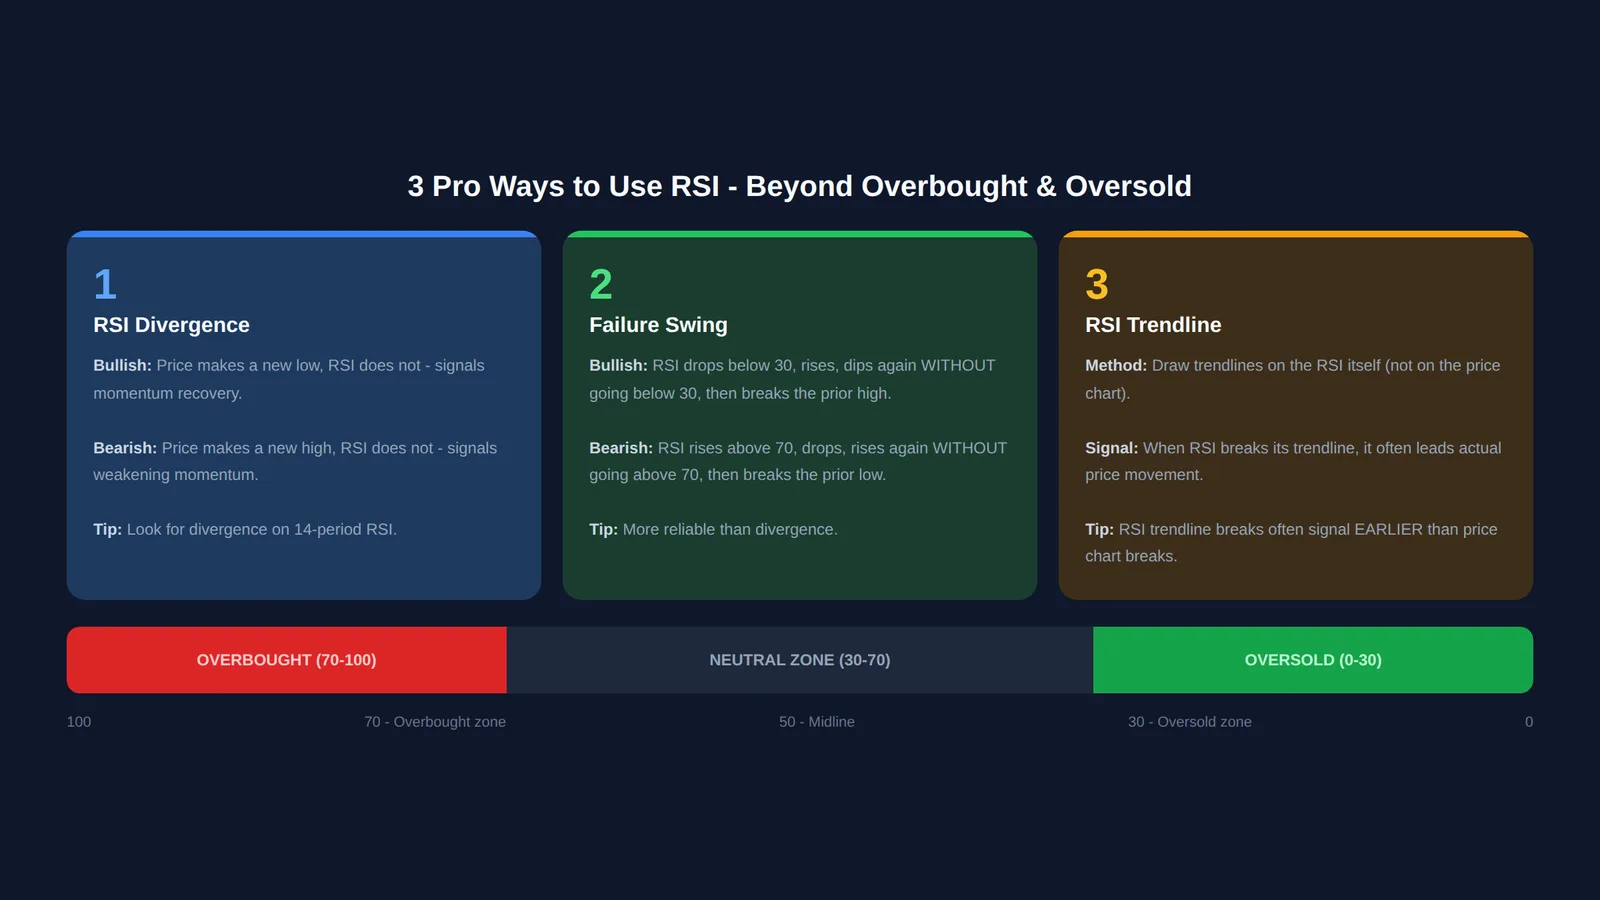
So, if you have only been using RSI to watch the 30 and 70 levels, you are only using about 20% of this indicator's true potential. In this article, you will learn 3 RSI techniques used by professional traders: RSI Divergence, RSI Failure Swing, and RSI Trendline Breakout. All three techniques can help you detect trend changes early, before price confirms them.
Technique 1 - RSI Divergence (Bullish & Bearish)
RSI Divergence occurs when price movement and RSI movement are not aligned - they move in opposite directions. This is an early warning signal that the current trend may be weakening and could potentially reverse.
There are two main types of divergence you need to master:
Bullish Divergence
Bullish divergence occurs when price makes a lower low, but RSI makes a higher low. What does this mean? Even though price has fallen to a lower level, selling momentum is actually weakening. Selling pressure is running out of steam.
Example on Bursa Malaysia: Suppose Maybank's price drops to RM9.00 and RSI stands at 25. The price then bounces up before falling again to RM8.80. But this time, RSI only drops to 32, not below 25 as before. This is a bullish divergence - a signal that selling pressure is weakening and price may be about to rise.
Bearish Divergence
Bearish divergence is the opposite. Price makes a higher high, but RSI makes a lower high. This means that even though price is still rising, buying momentum is weakening. Buyers are losing steam.
Imagine you are looking at the chart for Inari Amertron rising from RM3.00 to RM3.50 with RSI reaching 75. Price then pulls back slightly before rising again to RM3.70 - a new high. But this time RSI only reaches 68, lower than the previous 75. This is a bearish divergence, warning that the rally may be nearing its end.
Hidden Divergence
Besides regular divergence, there is also hidden divergence which functions as a trend continuation signal, not a reversal signal. According to StockCharts, hidden divergence is less well-known but very useful for confirming that the current trend is still strong.
- Hidden bullish divergence: Price makes a higher low, but RSI makes a lower low. The uptrend is still strong.
- Hidden bearish divergence: Price makes a lower high, but RSI makes a higher high. The downtrend is still strong.
Divergence is not a precise entry signal on its own - it is an early warning. You still need confirmation from price action or other indicators before taking action. Do not enter a position just because you spot divergence without any other confirmation.
Technique 2 - RSI Failure Swing
If divergence is the warning, then failure swing is the confirmation. Wilder himself considered the failure swing to be the most reliable RSI signal because it does not depend on comparing price and RSI - it relies entirely on RSI movement alone.
Failure swing has two forms:
Bullish Failure Swing (Buy Signal)
A bullish failure swing occurs in 4 steps:
- RSI drops below 30 (enters the oversold zone)
- RSI bounces back above 30
- RSI pulls back down again, but stays above 30 - it does not fall back below 30
- RSI then breaks above the previous high (the high made in step 2)
When step four occurs, that is your buy signal. RSI "failed" to return below 30, showing that sellers are not strong enough to push the price lower. This is called a "failure swing" because RSI failed to continue in its original direction.
As an example, imagine Gamuda is under selling pressure and RSI falls to 22. RSI then rises to 38, before dropping back to 33. Notice that RSI did not fall back below 30. When RSI subsequently rises above 38 (the previous high), that is a complete bullish failure swing - a strong buy signal.
Bearish Failure Swing (Sell Signal)
A bearish failure swing is the opposite:
- RSI rises above 70 (enters the overbought zone)
- RSI drops below 70
- RSI attempts to rise again, but fails to break above 70
- RSI then falls below the previous low (the low made in step 2)
When step four occurs, that is your sell signal. RSI "failed" to re-enter the overbought zone, showing that buyers have lost momentum.
According to Fidelity Investments, the failure swing is considered more reliable than divergence because it is a more definitive signal - RSI itself has already confirmed the momentum shift without needing to compare it against price movement.
Why Is the Failure Swing More Reliable?
Divergence can sometimes drag on - price can keep rising for weeks even after a bearish divergence appears. The failure swing is more specific because it has a clear trigger point - namely when RSI breaks past the previous high or low. You know exactly where the signal is triggered, and you can set your entry and stop loss with greater confidence.
Technique 3 - RSI Trendline Breakout
This third technique is perhaps the least well-known, but it is extremely powerful. The concept is simple: draw trendlines on RSI the same way you draw trendlines on price charts.
Yes, you read that right. You can draw trend lines, support, and resistance directly on the RSI window.
How to Draw Them
For a descending trendline on RSI, connect two or more RSI peaks (highs) that are progressively lower. For an ascending trendline, connect two or more RSI troughs (lows) that are progressively higher. Use a platform like TradingView that allows you to draw lines directly on the RSI panel.
When RSI breaks through the trendline you have drawn, it signals a breakout - a shift in momentum is taking place. What makes this technique particularly interesting is that RSI trendline breakouts often occur earlier than price breakouts. This means you can detect trend changes before they become visible on the price chart.
Practical Example
Suppose you are looking at the chart for Petronas Chemicals. Price has been in a downtrend for several weeks. On the RSI, you draw a descending trendline connecting several RSI peaks that are progressively lower. Suddenly, RSI breaks above that descending trendline - even though price has not yet shown any clear signs of reversal.
This is an early signal that selling momentum is weakening and a reversal may occur soon. Combine this signal with divergence or a failure swing, and you have a very strong setup.
For a deeper guide on this technique, read RSI Trendline Breakout Trading Strategy.
Practical RSI Pro Examples on Bursa Malaysia
Theory without real examples does not mean much. So let us look at how these pro RSI techniques can be applied to some popular stocks on Bursa Malaysia.
Bearish Divergence on Glove Stocks
During the glove stock rally in 2020, Top Glove and Hartalega displayed classic bearish divergence at the peak of their rally. Price kept making new highs, but the weekly RSI had already started showing progressively lower peaks. Traders who were alert to this signal had early warning before the major decline began.
This does not mean you can time the exact top. But bearish divergence at least tells you that momentum has started weakening - time to be cautious, tighten your stop loss, or reduce your position size.
Bullish Failure Swing on Blue Chip Stocks
CIMB and Tenaga Nasional often display clean failure swings on the daily chart during market corrections. When RSI falls below 30 during a sell-off, then tries to drop again but fails to break below 30, it typically signals that institutional buyers are quietly stepping in.
Blue chip stocks tend to show cleaner failure swings compared to small caps because institutional fund flows are more pronounced and consistent.
RSI Trendline Breakout on Technology Stocks
Technology stocks like Frontken and Press Metal often show strong moves following an RSI trendline breakout. This is because these stocks typically move in clear trends - either up or down - making trendlines on RSI easier to draw and more meaningful when broken.
When RSI breaks above a descending trendline during an accumulation phase, it often marks the beginning of a significant upward move - especially when supported by increasing volume.
Common Mistakes When Using RSI
RSI looks simple, but many traders still make basic mistakes that reduce its effectiveness. Here are the most common mistakes you need to avoid.
1. Using RSI Alone Without Confirmation
This is the number one mistake. You see RSI below 30 and immediately buy without checking anything else. RSI below 30 does not mean price will definitely rise - it only means price has fallen significantly over a certain period. In a strong downtrend, RSI can stay below 30 for weeks. Always use RSI together with other indicators or at the very least with price action analysis.
2. Using the Wrong Period Setting
The standard RSI uses a period of 14. Many traders switch to shorter periods like 7 or 9 without understanding the implications. A shorter period produces a more sensitive RSI - it will reach 30 and 70 more frequently, generating more signals but also more false signals.
Conversely, a longer period like 21 produces a smoother RSI - fewer signals, but more reliable ones. According to Investopedia, the default period of 14 is the best starting point before making any adjustments.
3. Ignoring Trend Context
RSI behaves differently in trending markets versus sideways markets. In a strong uptrend, RSI may rarely drop below 40, let alone 30. So waiting for RSI to reach 30 to buy in a strong uptrend means you will miss most opportunities. In an uptrend, RSI around 40-50 can already be considered a "relatively oversold" zone.
Wilder himself proposed the concept of RSI range shift - in an uptrend, RSI tends to oscillate between 40-80, while in a downtrend it ranges between 20-60.
4. Overlooking Obvious Divergence
Many traders only look at the RSI number without comparing RSI patterns with price patterns. Divergence is one of the most powerful signals RSI offers, but it is only visible to those who actively look for it. Make it a habit to always compare RSI peaks and troughs with price peaks and troughs.
5. No Plan for Stop Loss and Take Profit
RSI tells you about momentum, but it is not a tool for determining where to place your stop loss or profit target. You still need support and resistance levels, or other tools like Fibonacci Retracement to set meaningful exit points. Entering a position based on RSI without an exit plan is a recipe for losses.
RSI + Other Indicators: Effective Combinations
RSI is most powerful when combined with other indicators that complement its weaknesses. Here are the three most popular and effective combinations.
RSI + MACD: Double-Layer Momentum Confirmation
This is perhaps the most classic combination in technical analysis. RSI tells you the current momentum status (overbought, oversold, or divergence), while MACD tells you the direction and strength of momentum through crossovers and its histogram.
A strong setup: RSI shows bullish divergence, and at roughly the same time, the MACD histogram starts shrinking from negative toward positive, followed by a bullish MACD crossover. When both momentum indicators agree, confidence in the signal increases significantly.
RSI + Bollinger Bands: Double Extreme Zones
Bollinger Bands show volatility and extreme price zones, while RSI measures momentum. When price touches the lower Bollinger Band and RSI simultaneously reads below 30, you have double confirmation that price is in an extreme zone.
This combination works best in sideways markets. In trending markets, price can "walk along the band" for weeks, so an oversold RSI reading does not necessarily signal a buy.
RSI + Volume: The Real Strength Behind the Move
Volume confirms the validity of RSI signals. For example, if you spot bullish divergence on RSI and selling volume is simultaneously shrinking, this confirms that selling pressure is genuinely weakening - not just an RSI illusion.
Conversely, if RSI shows bullish divergence but selling volume remains high, be cautious - sellers are still active even though RSI suggests their momentum is fading.
For a deeper understanding of how to systematically combine multiple indicators, read 3 Indicators, 1 System: Combining Fibonacci, MACD & Ichimoku with Confluence Trading. The same confluence concept applies when you combine RSI with other indicators.
Frequently Asked Questions (FAQ)
What is RSI divergence in stocks?
RSI divergence occurs when the direction of price movement does not align with the direction of RSI movement. For example, price makes a new low but RSI makes a higher low (bullish divergence) - indicating that momentum is weakening and a reversal may be about to occur.
What is the difference between RSI divergence and RSI failure swing?
Divergence compares price movement with RSI movement to detect momentum weakness. Failure swing relies solely on RSI movement - it looks at whether RSI fails to return to the extreme zone (above 70 or below 30) on its second attempt. The failure swing is considered more reliable because it provides a more specific signal with a clear trigger point.
Can RSI divergence give false signals?
Yes, it can. Divergence can appear too early and price can continue moving in the same direction for weeks before a reversal actually occurs. This is called extended divergence. That is why you should not use divergence as the sole basis for entering a position. Always wait for confirmation from a failure swing, price breakout, or other indicators before acting.
What is the best RSI setting for Bursa Malaysia stocks?
The default RSI setting of 14 works well for most Bursa Malaysia stocks, especially on the daily chart. For swing trading, some traders use RSI 21 for smoother and less sensitive signals. For short-term trading, RSI 9 can be used but it will generate more false signals. Start with RSI 14 before experimenting with other settings.
How do you draw trendlines on RSI?
You draw trendlines on RSI the same way you draw trendlines on price charts. For a descending trendline, connect two or more RSI peaks that are progressively lower. For an ascending trendline, connect two or more RSI troughs that are progressively higher. Platforms like TradingView allow you to draw lines directly on the RSI indicator panel. When RSI breaks through that trendline, it signals a change in momentum.
Are these pro RSI techniques suitable for beginners?
Yes, but master the basics of reading RSI first before moving on to divergence and failure swing. Failure swing is easier to follow because its steps are clearly defined. Use the Mahersaham Chart Game to practice without risk before using real capital.
On which timeframe is RSI divergence most effective?
RSI divergence is most reliable on daily and weekly charts. On shorter timeframes like 5 or 15 minutes, divergence appears more often but false signals are also much higher. For retail investors on Bursa Malaysia, the daily chart is the most practical.
Can RSI divergence be used alongside fundamental analysis?
Absolutely. Fundamentals tell you what to buy (low PE, strong financials), while RSI tells you when to buy through divergence and failure swing. For a deeper understanding of the technical terms used in this article, refer to Stochastic RSI on TradingView for more RSI-family indicator insights.
Conclusion
RSI is not just a tool for identifying overbought and oversold conditions. The divergence, failure swing, and trendline breakout techniques make RSI one of the most versatile indicators in any trader's toolkit. Master all three techniques, and you will have a significant edge over ordinary retail investors who only know how to watch the 30 and 70 levels.
The key is practice and patience. The more charts you analyze, the sharper your eye becomes at spotting divergence and failure swings naturally.
Sharpen your RSI reading skills with 40 real Bursa Malaysia charts on the Mahersaham Chart Game. Free to try.
Open a CDS account with M+ to start investing on Bursa Malaysia as well as international stocks including the US and Hong Kong markets.
Download our free Stock Basics Ebook to build a solid investment foundation.