How to Sell US Stocks on M+ Global: A Real Take-Profit Walkthrough (+17%)

Anyone can teach you how to buy a stock. But when it is time to sell - that is where most people hesitate. How do you check your actual profit? Where does that "Cost" number in your portfolio come from? What price should you set so it sells immediately? And how much will the fees take?
In this tutorial we answer all of those questions with one real trade: we sold 50 shares of OSW (OneSpaWorld Holdings, NASDAQ) that we had held since February, sitting on a gain of around 20%. Every screen was captured from start to finish. This is the companion piece to our tutorial on buying US stocks in the M+ Global app - this time we complete the full cycle through to taking profit.
This article is for educational purposes only and is not investment advice or a recommendation. OSW is used purely as a demonstration example. Always do your own research before making any buy or sell decision.
Step 1: Check Your Portfolio in the Positions Tab
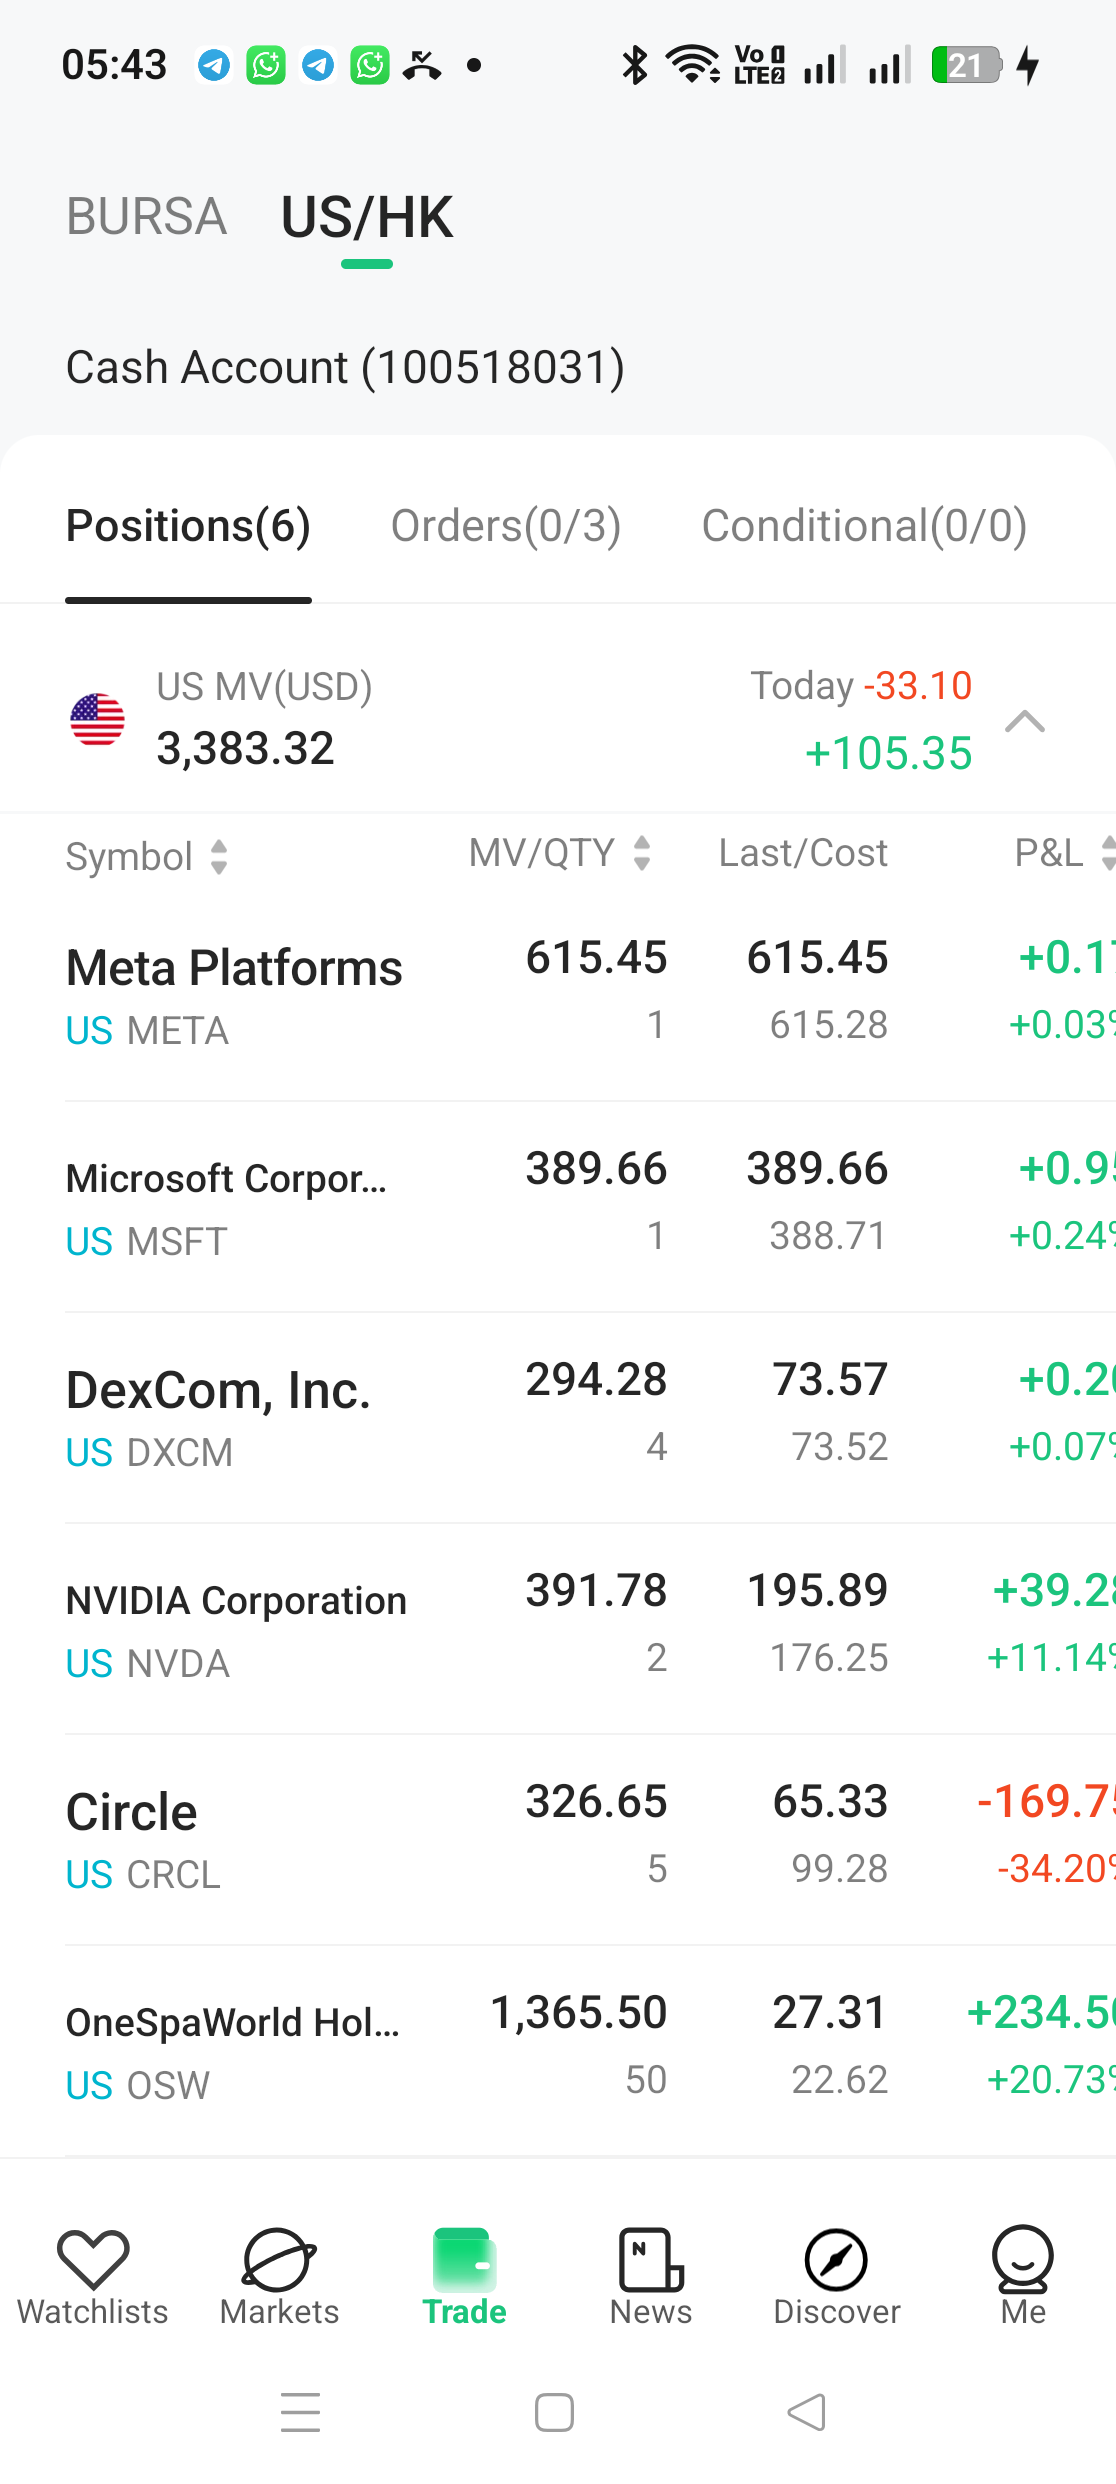
Everything starts at the Trade tab → Positions. This is where all your holdings live. Three columns you must understand:
- MV/QTY - Market Value of the holding and the number of shares. Our OSW: USD 1,365.50 across 50 shares.
- Last/Cost - Last is the latest market price (27.31), while Cost is your average purchase price (22.62). These two numbers determine your profit or loss.
- P&L - Profit & Loss: (Last − Cost) × quantity. For OSW: (27.31 − 22.62) × 50 = +234.50 USD, or +20.73%.
The position was up 20%, and we decided to take profit. But before selling, let's first understand where that Cost figure comes from - because it confuses a lot of people.
Where Does the "Cost" Figure Come From? Check Your Purchase History
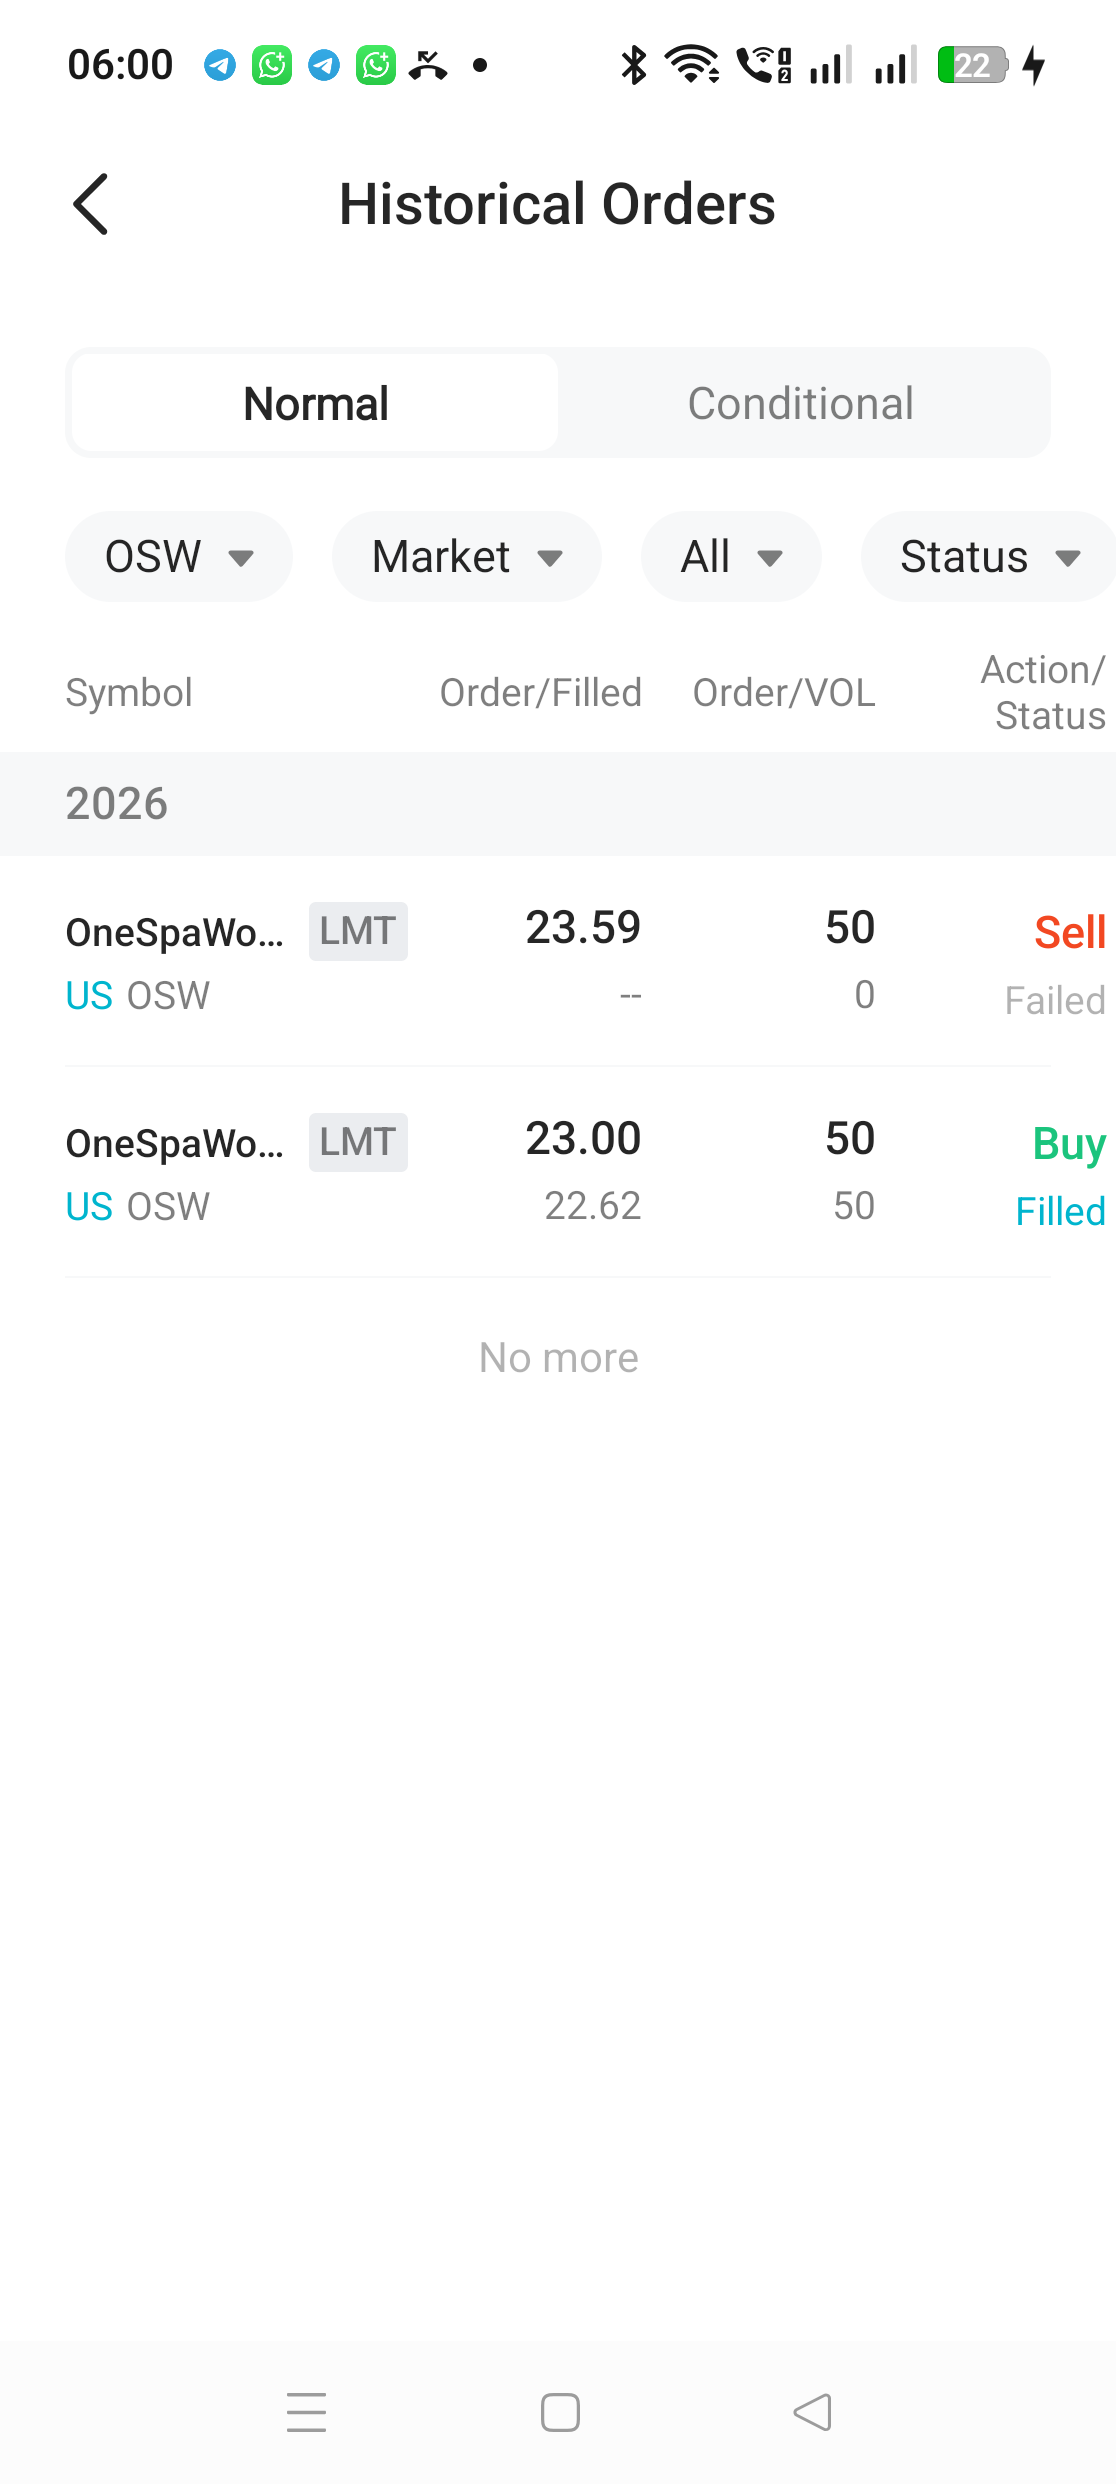
The Cost figure is not a mystery number - it comes directly from your buy orders. To check it: go to the Orders tab → tap Historical Orders in the corner → filter Symbol to the stock you want to review.
In our OSW case the history is simple: a single buy order from February 2026 - Buy Limit 23.00, filled at 22.62 for all 50 shares. That is exactly why Cost shows 22.62.
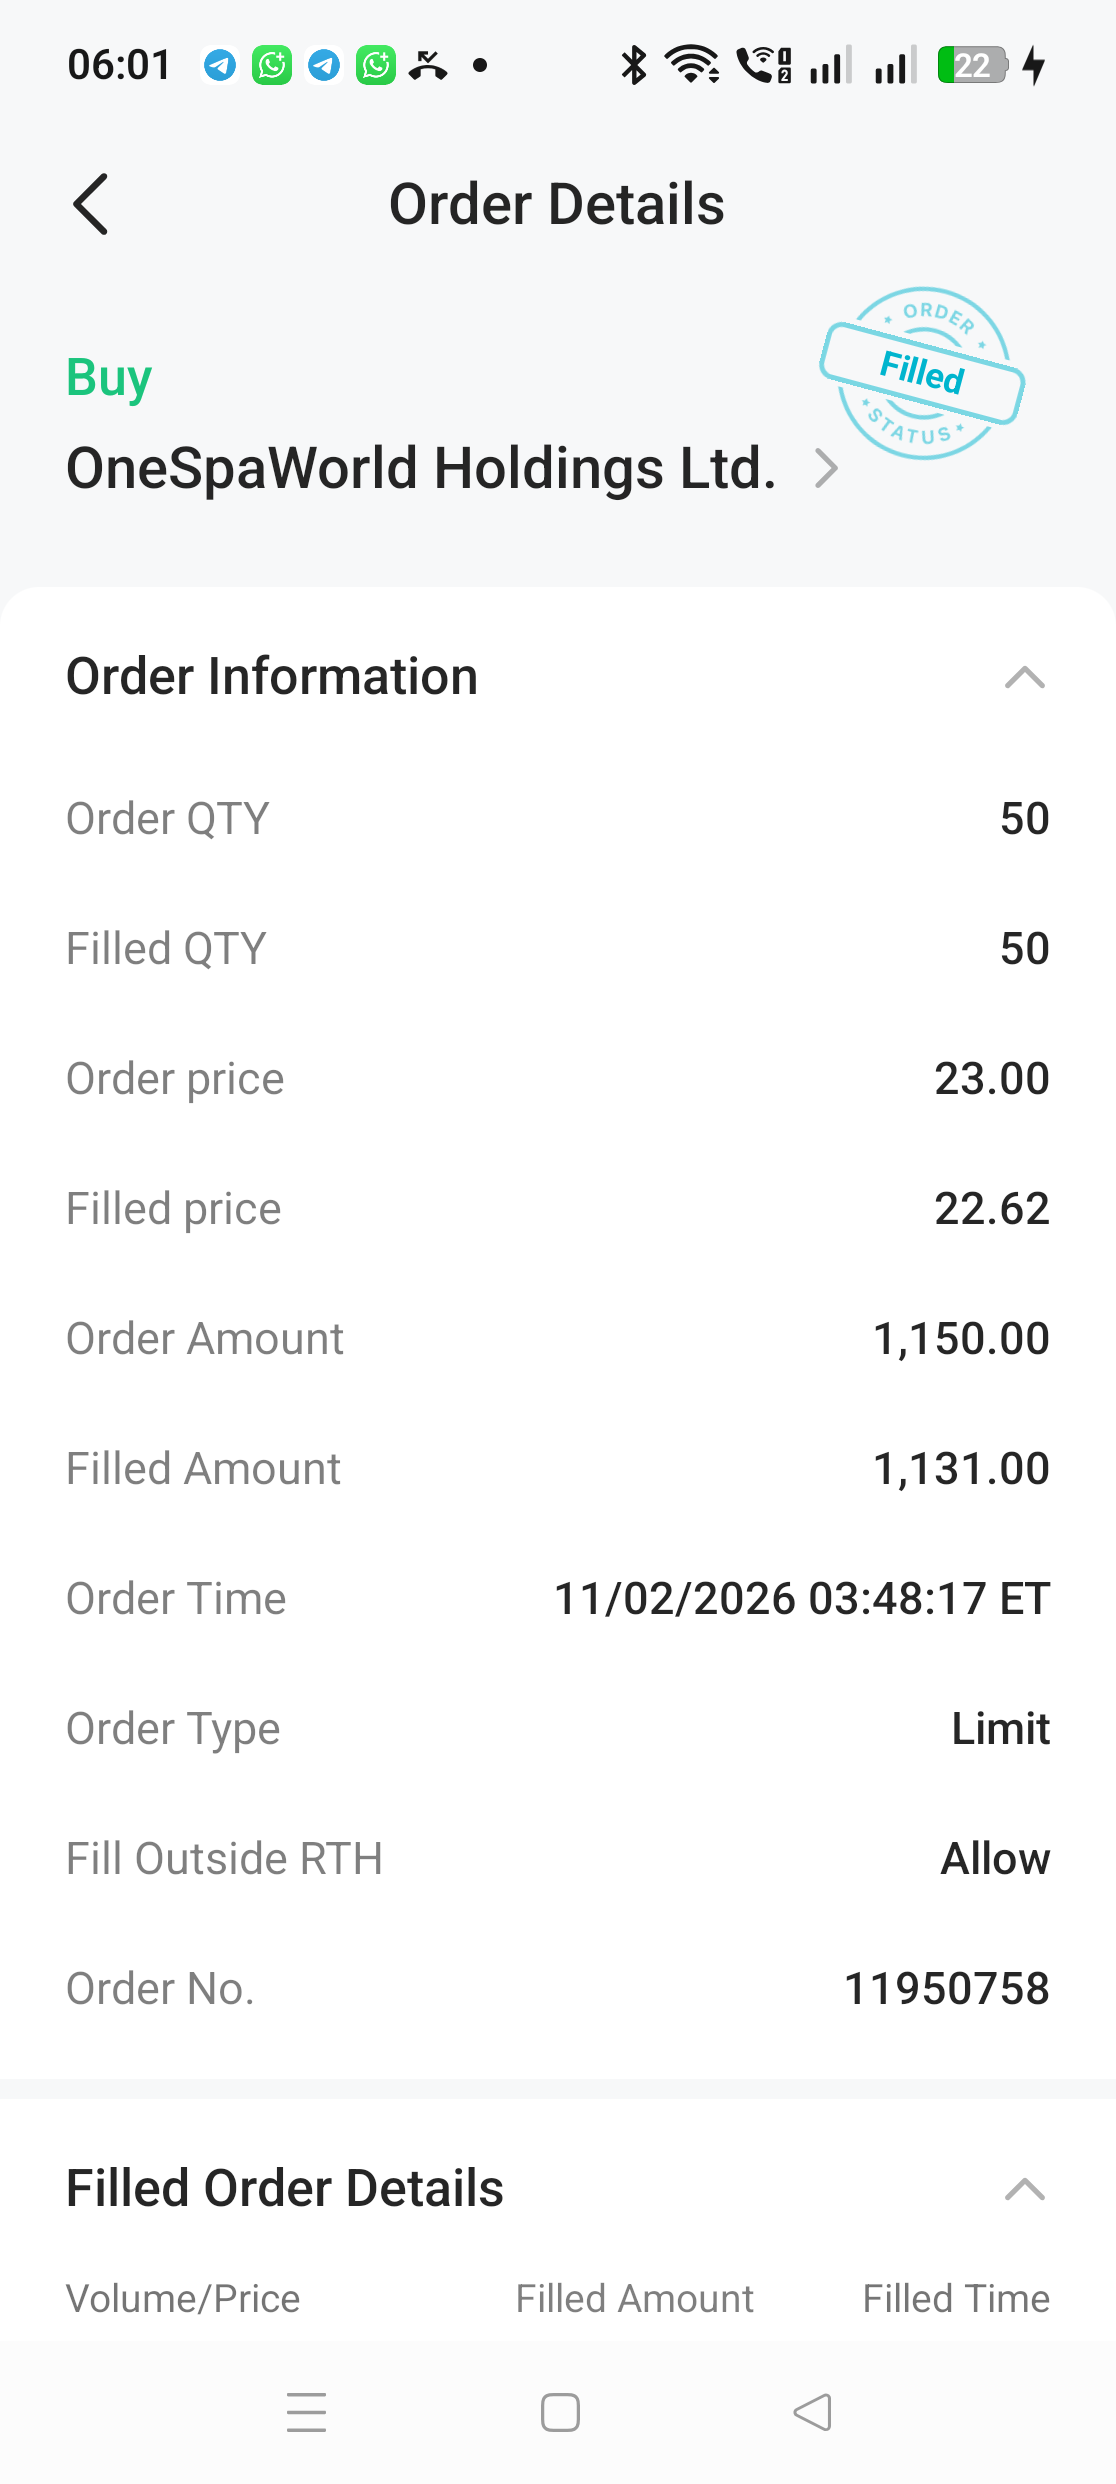
Tap the order for full details: Filled Amount USD 1,131.00 - that was our capital in this stock. Notice too that we had set a limit of 23.00 but got filled at 22.62 (price improvement, just like we showed in the buying tutorial).
What if you bought the same stock multiple times at different prices? Cost becomes the weighted average of all your purchases. The full formula and worked examples are in our article on average cost calculation for US/HK stocks - refer to it if your position was built in layers.
Get to Know the Trade Dashboard Too
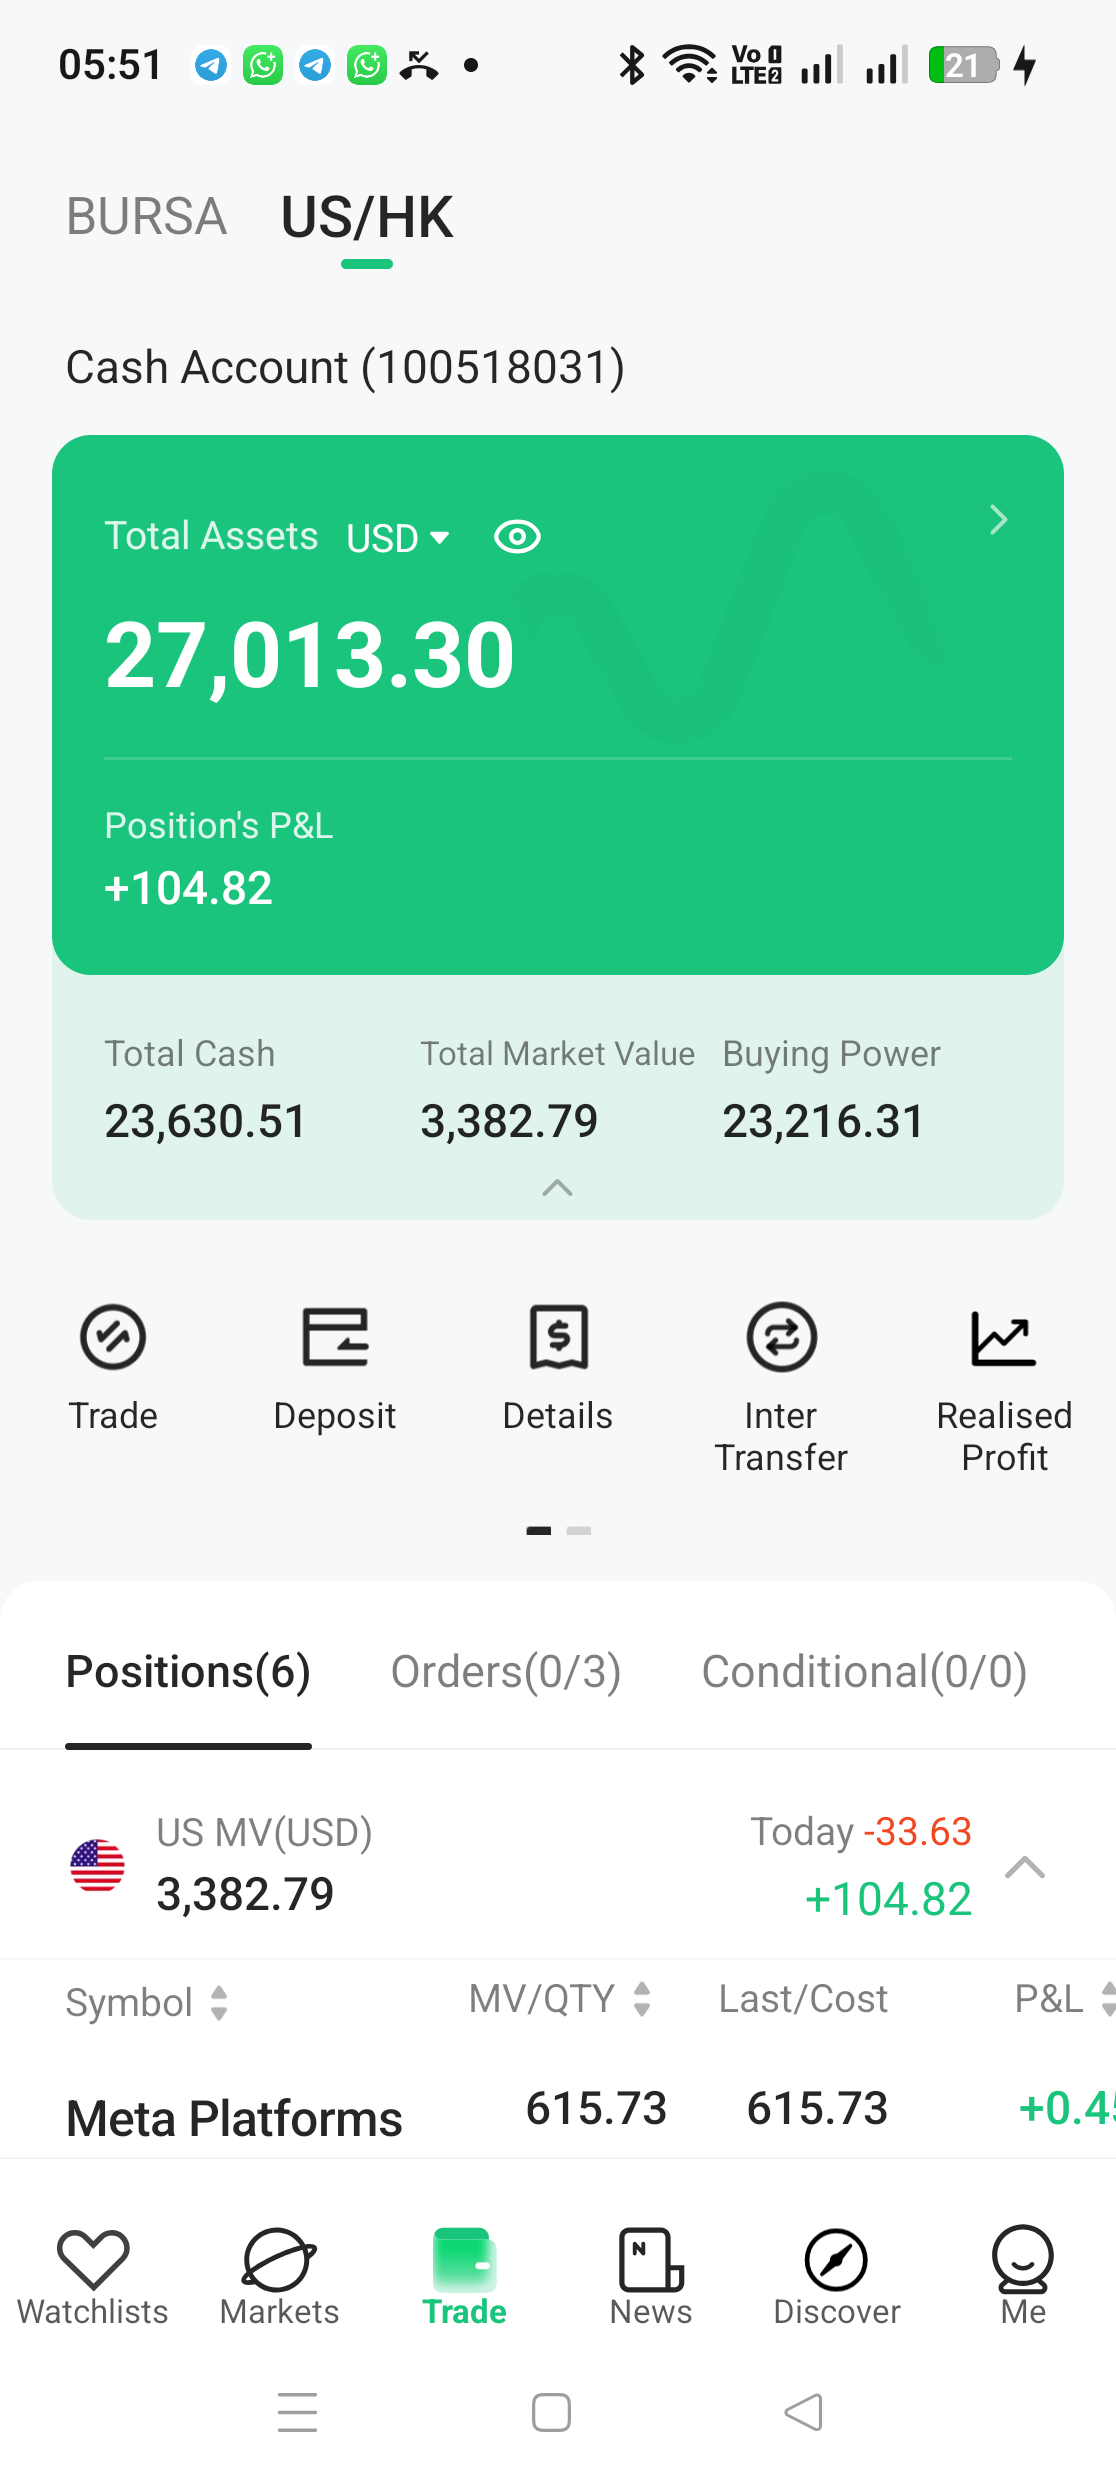
While on the Trade tab, scroll up and you will see the green account summary card: Total Assets, Total Cash, Total Market Value and Buying Power. Below it are five shortcut icons - note the Realised Profit icon; we will come back to it after the sale to see our realized profit record.
Step 2: Open the Sell Ticket
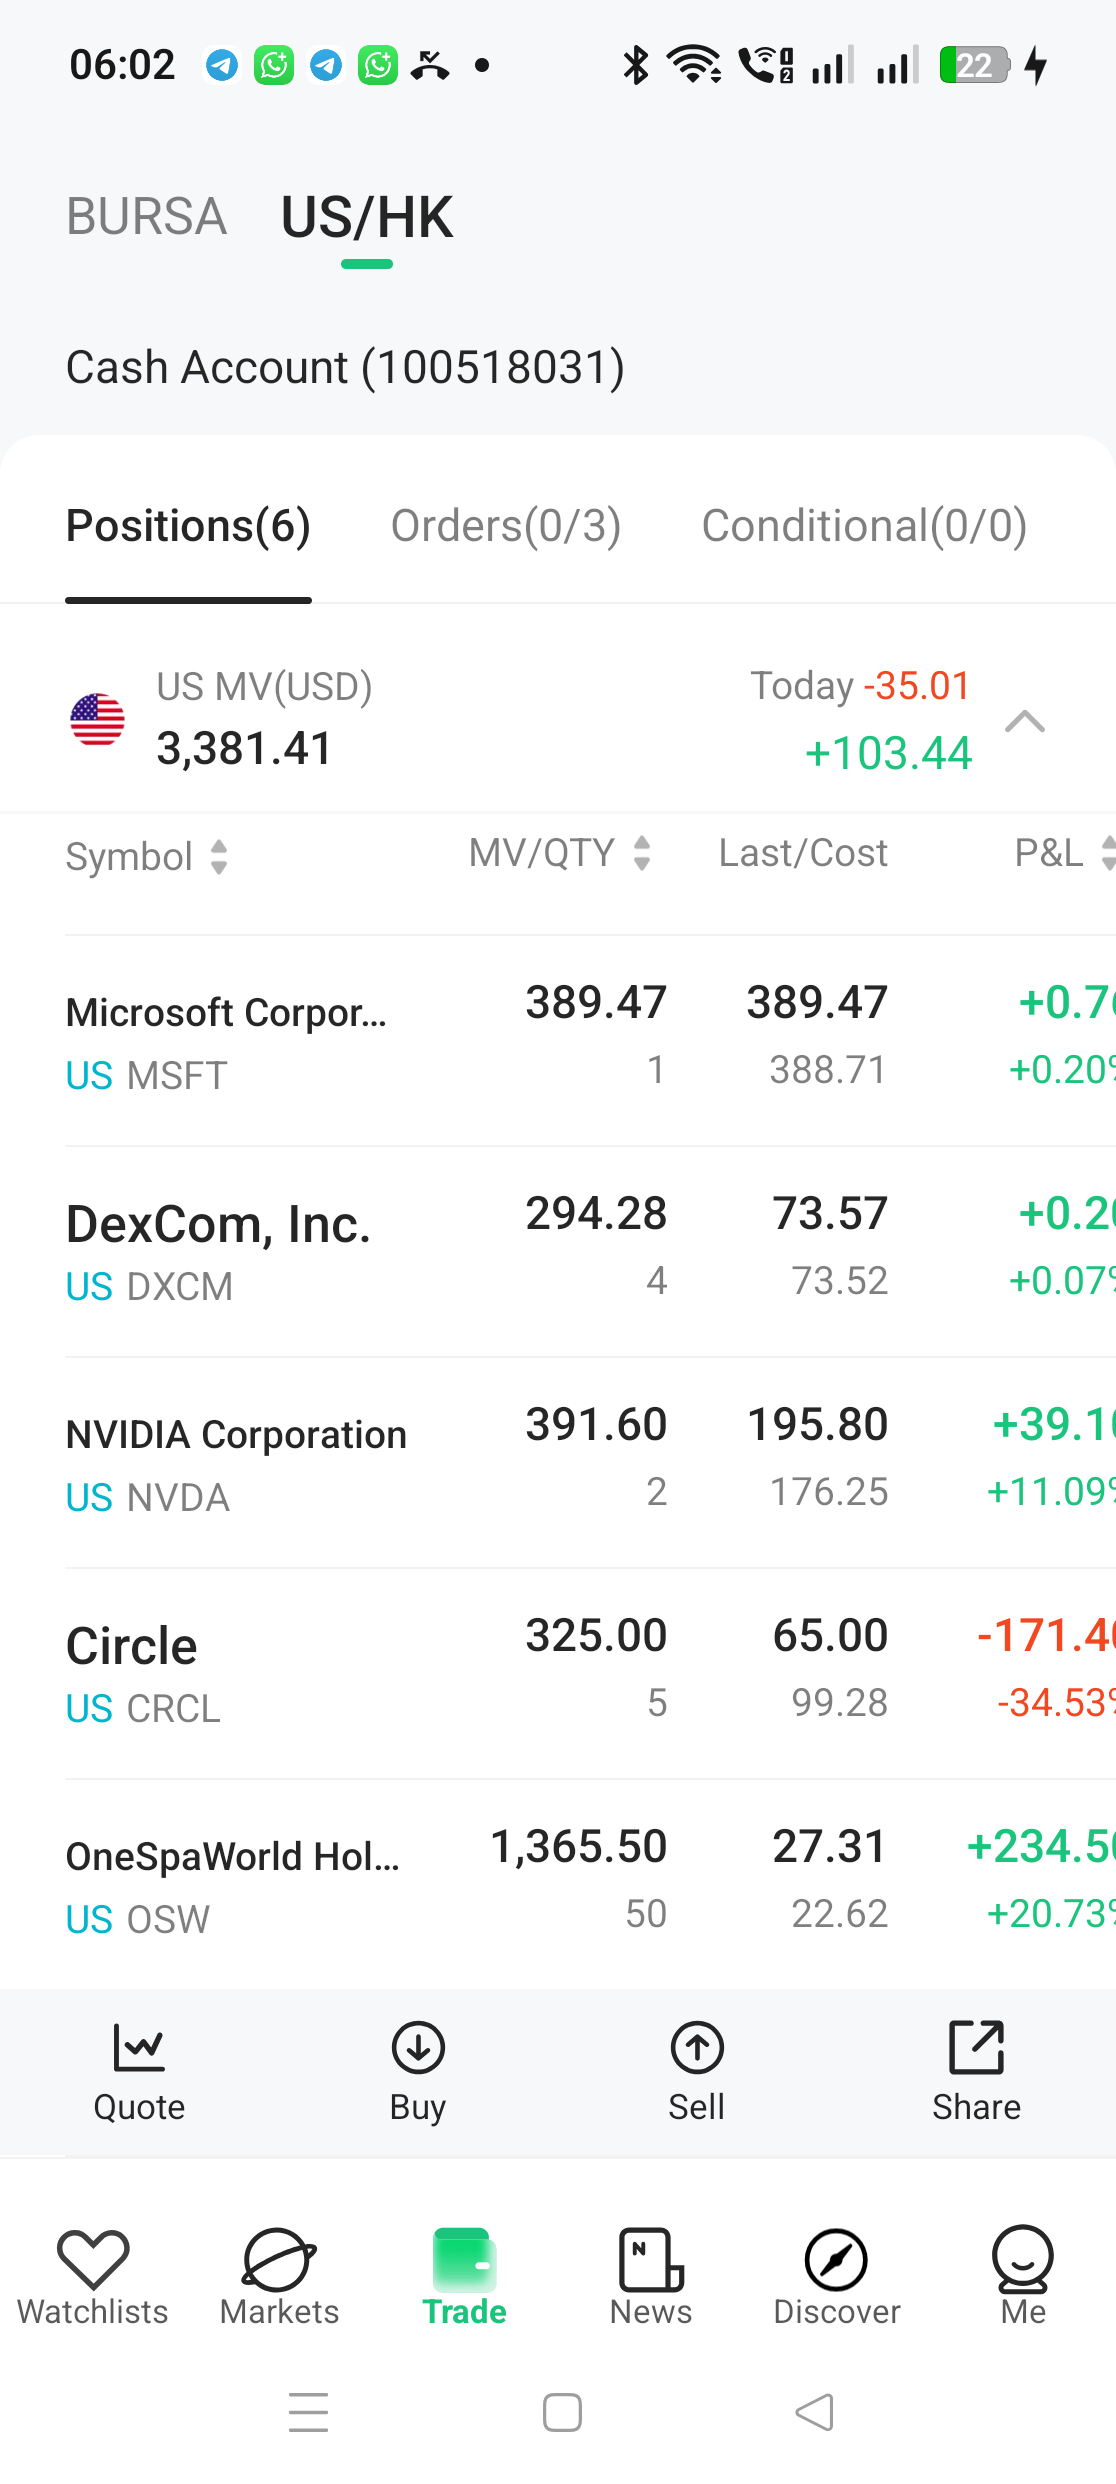
The fastest way to sell: in the Positions tab, tap the row of the stock you want to sell. An action bar appears with four options - Quote, Buy, Sell, and Share. Tap Sell.
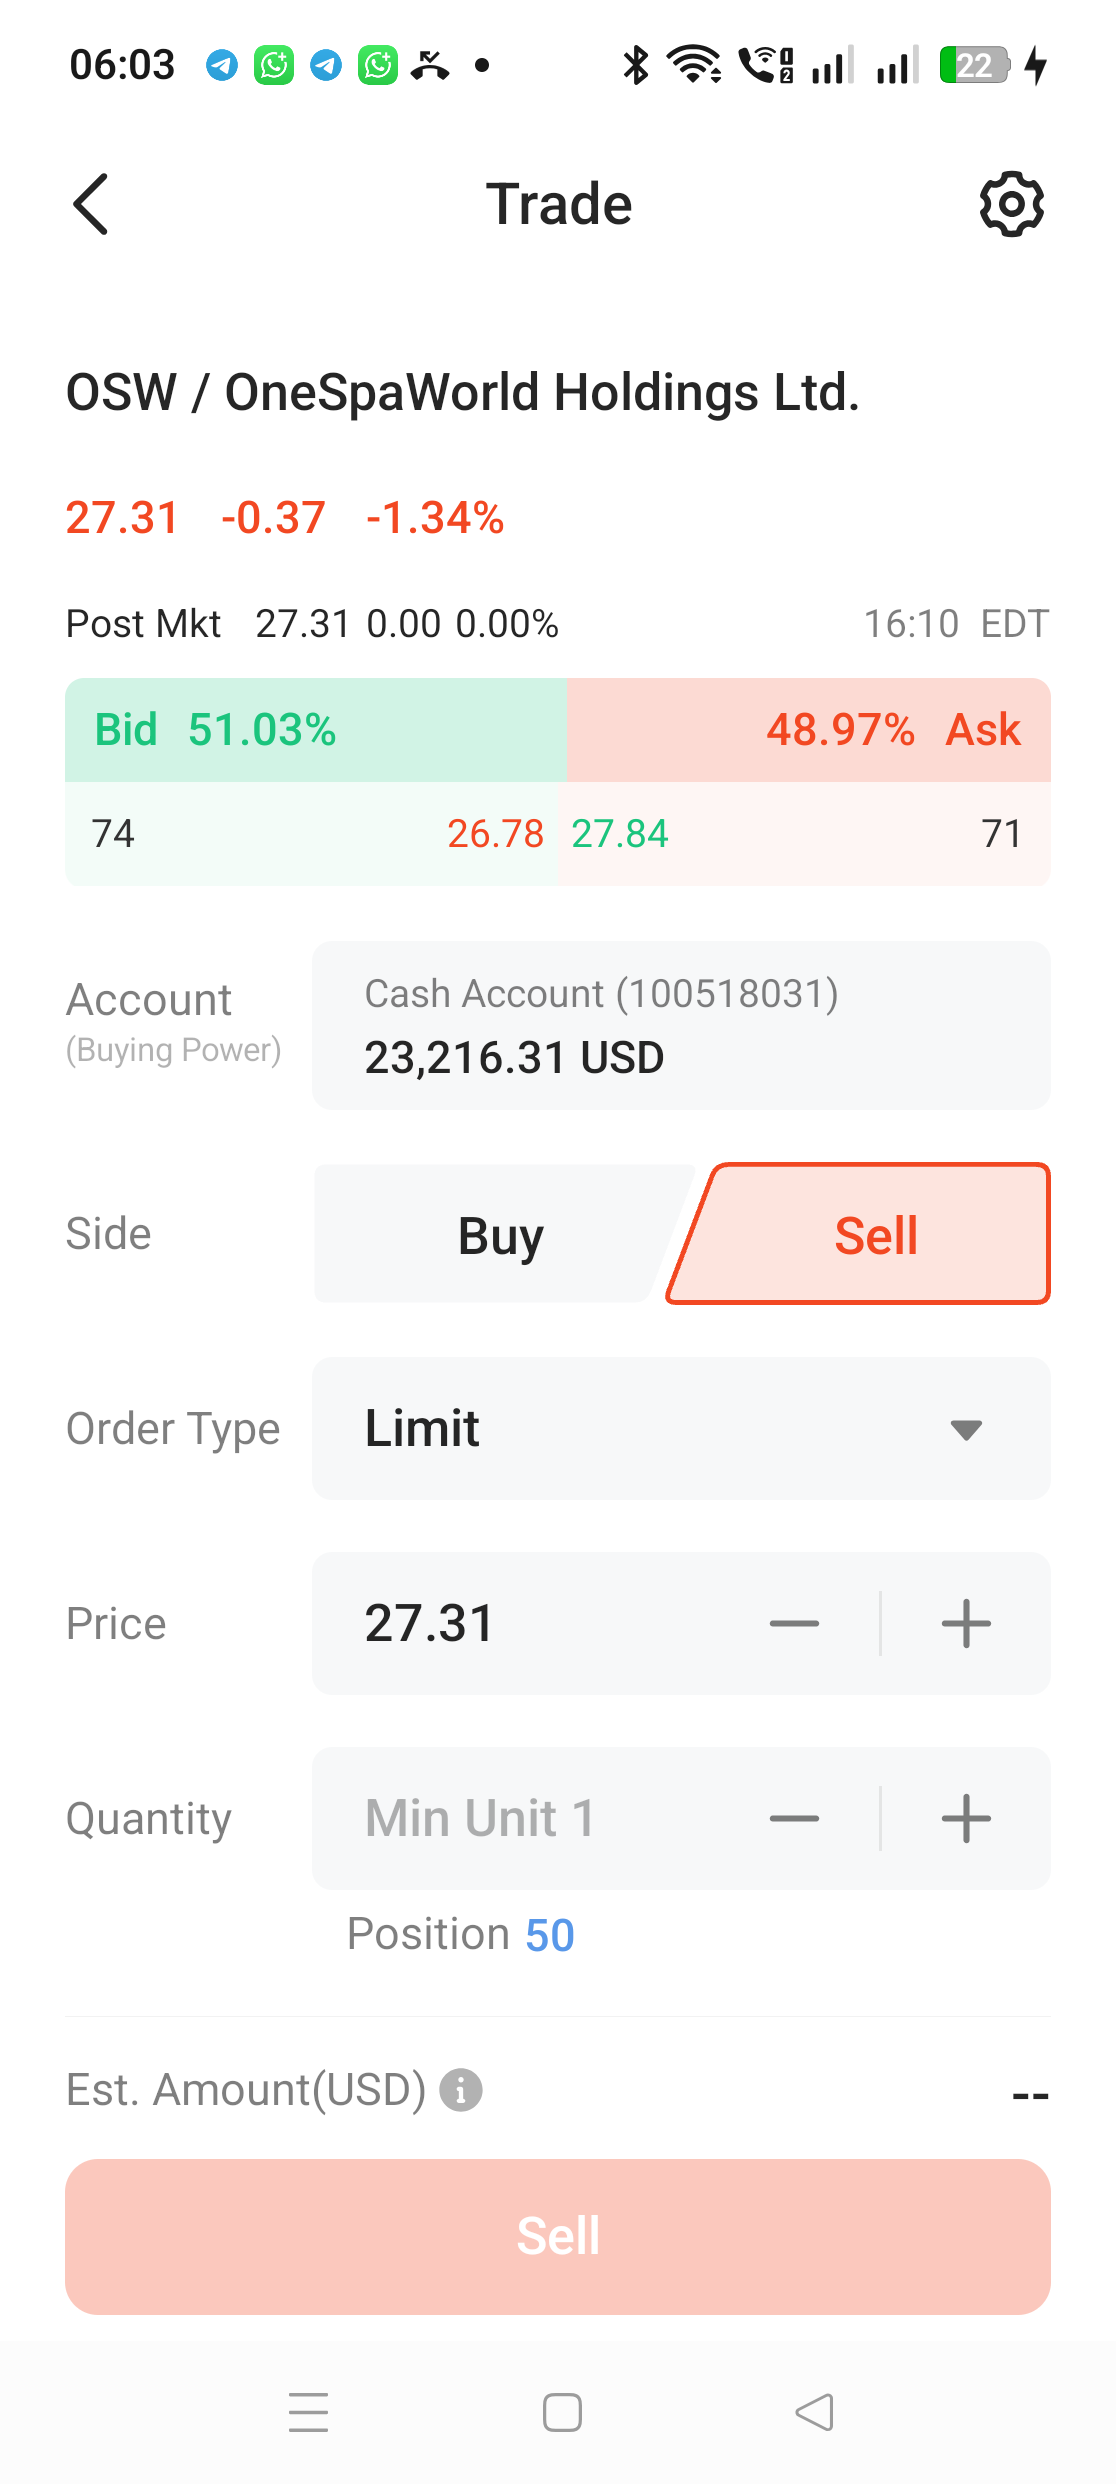
The order ticket opens with Side already switched to Sell (in red). The layout mirrors the buy ticket - but now our attention goes to the Bid side:
- Bid 26.78 × 74 - the highest buyer is paying 26.78, with 74 shares waiting
- Ask 27.84 × 71 - the lowest seller is asking 27.84
- Position 50 - the blue link under Quantity shows how many shares you hold
This demo was done at 6:07 am Malaysian time = 6:07 pm in New York, in the after-hours session. Notice the wide bid-ask spread (26.78 vs 27.84 - over a dollar!) - typical of extended hours when fewer participants are in the market. According to SEC investor guidance (investor.gov), this is one of the main risks of trading outside official hours. We explained extended hours in full in our US stock buying tutorial.
Step 3: Want an Instant Sale? Set Your Price = the Bid
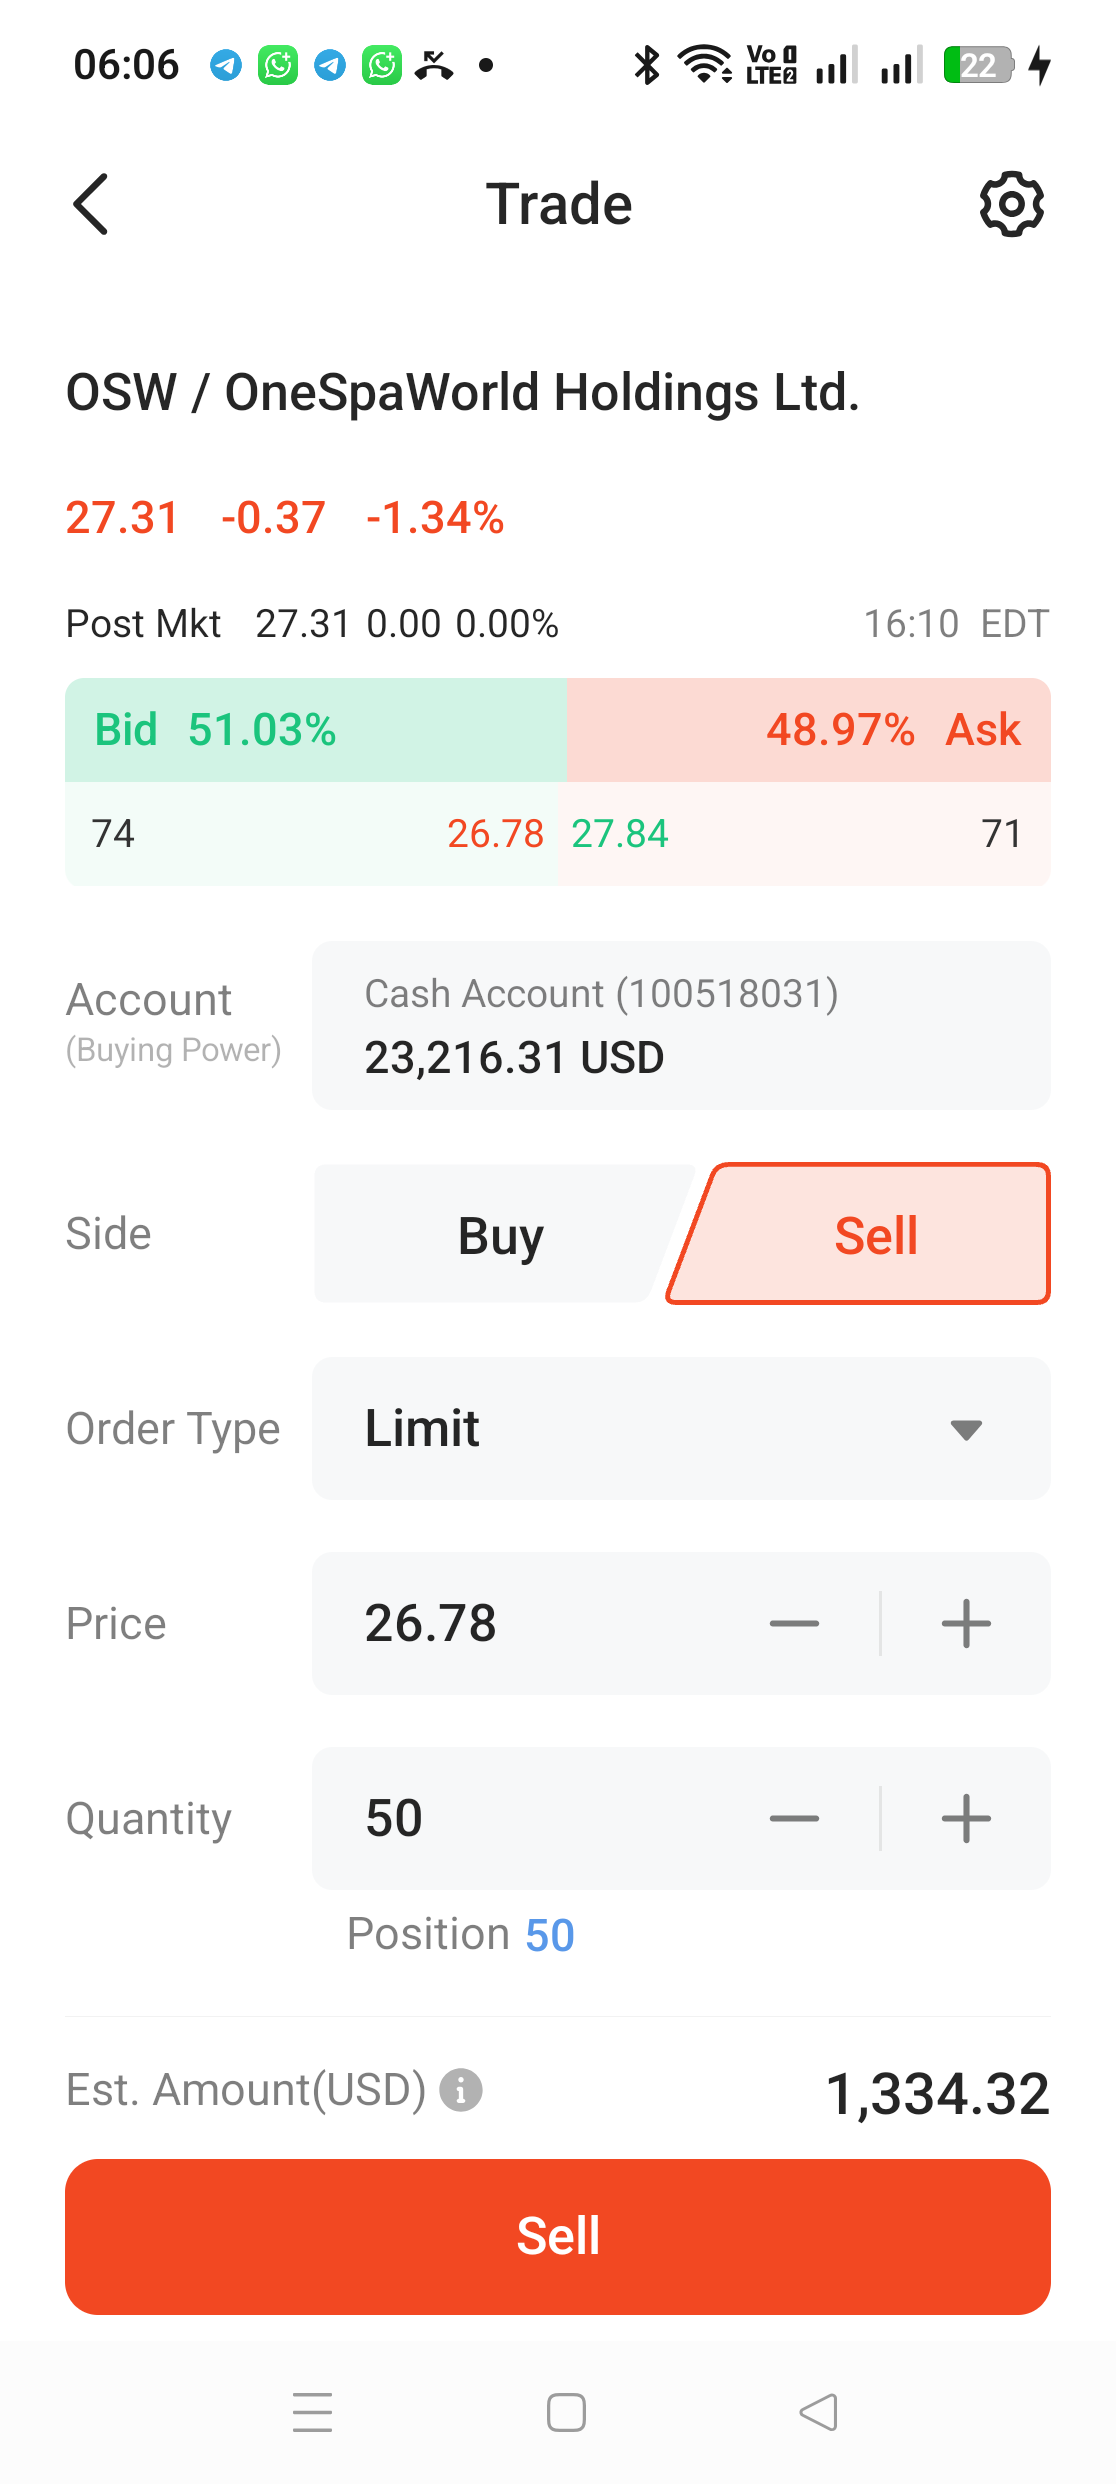
This is the same trick as when buying, but flipped. When buying, we set the limit = the Ask so it matches a waiting seller. When selling: set your limit price = the current Bid - because at that price there are buyers already waiting (74 shares' worth, more than enough for our 50).
For quantity, no typing needed - just tap the "Position 50" link and the app auto-fills your entire holding. Want to sell only part? Type the number yourself.
Before hitting the button, one important thing to understand - the hidden cost of selling at the bid during after-hours. The P&L on the Positions screen is computed at the Last price (27.31), showing +234.50. But the bid is only 26.78 - about 2% below. By selling at the bid, the profit we actually realized was (26.78 − 22.62) × 50 = +208, not +234. That is the price of certainty: you get an instant sale, but at the buyer's price rather than the last traded price. If you are not in a hurry, you can set a higher limit (say, mid-spread) and wait - or wait for regular hours when spreads are much tighter.
Check the Estimated Fees Before Sending
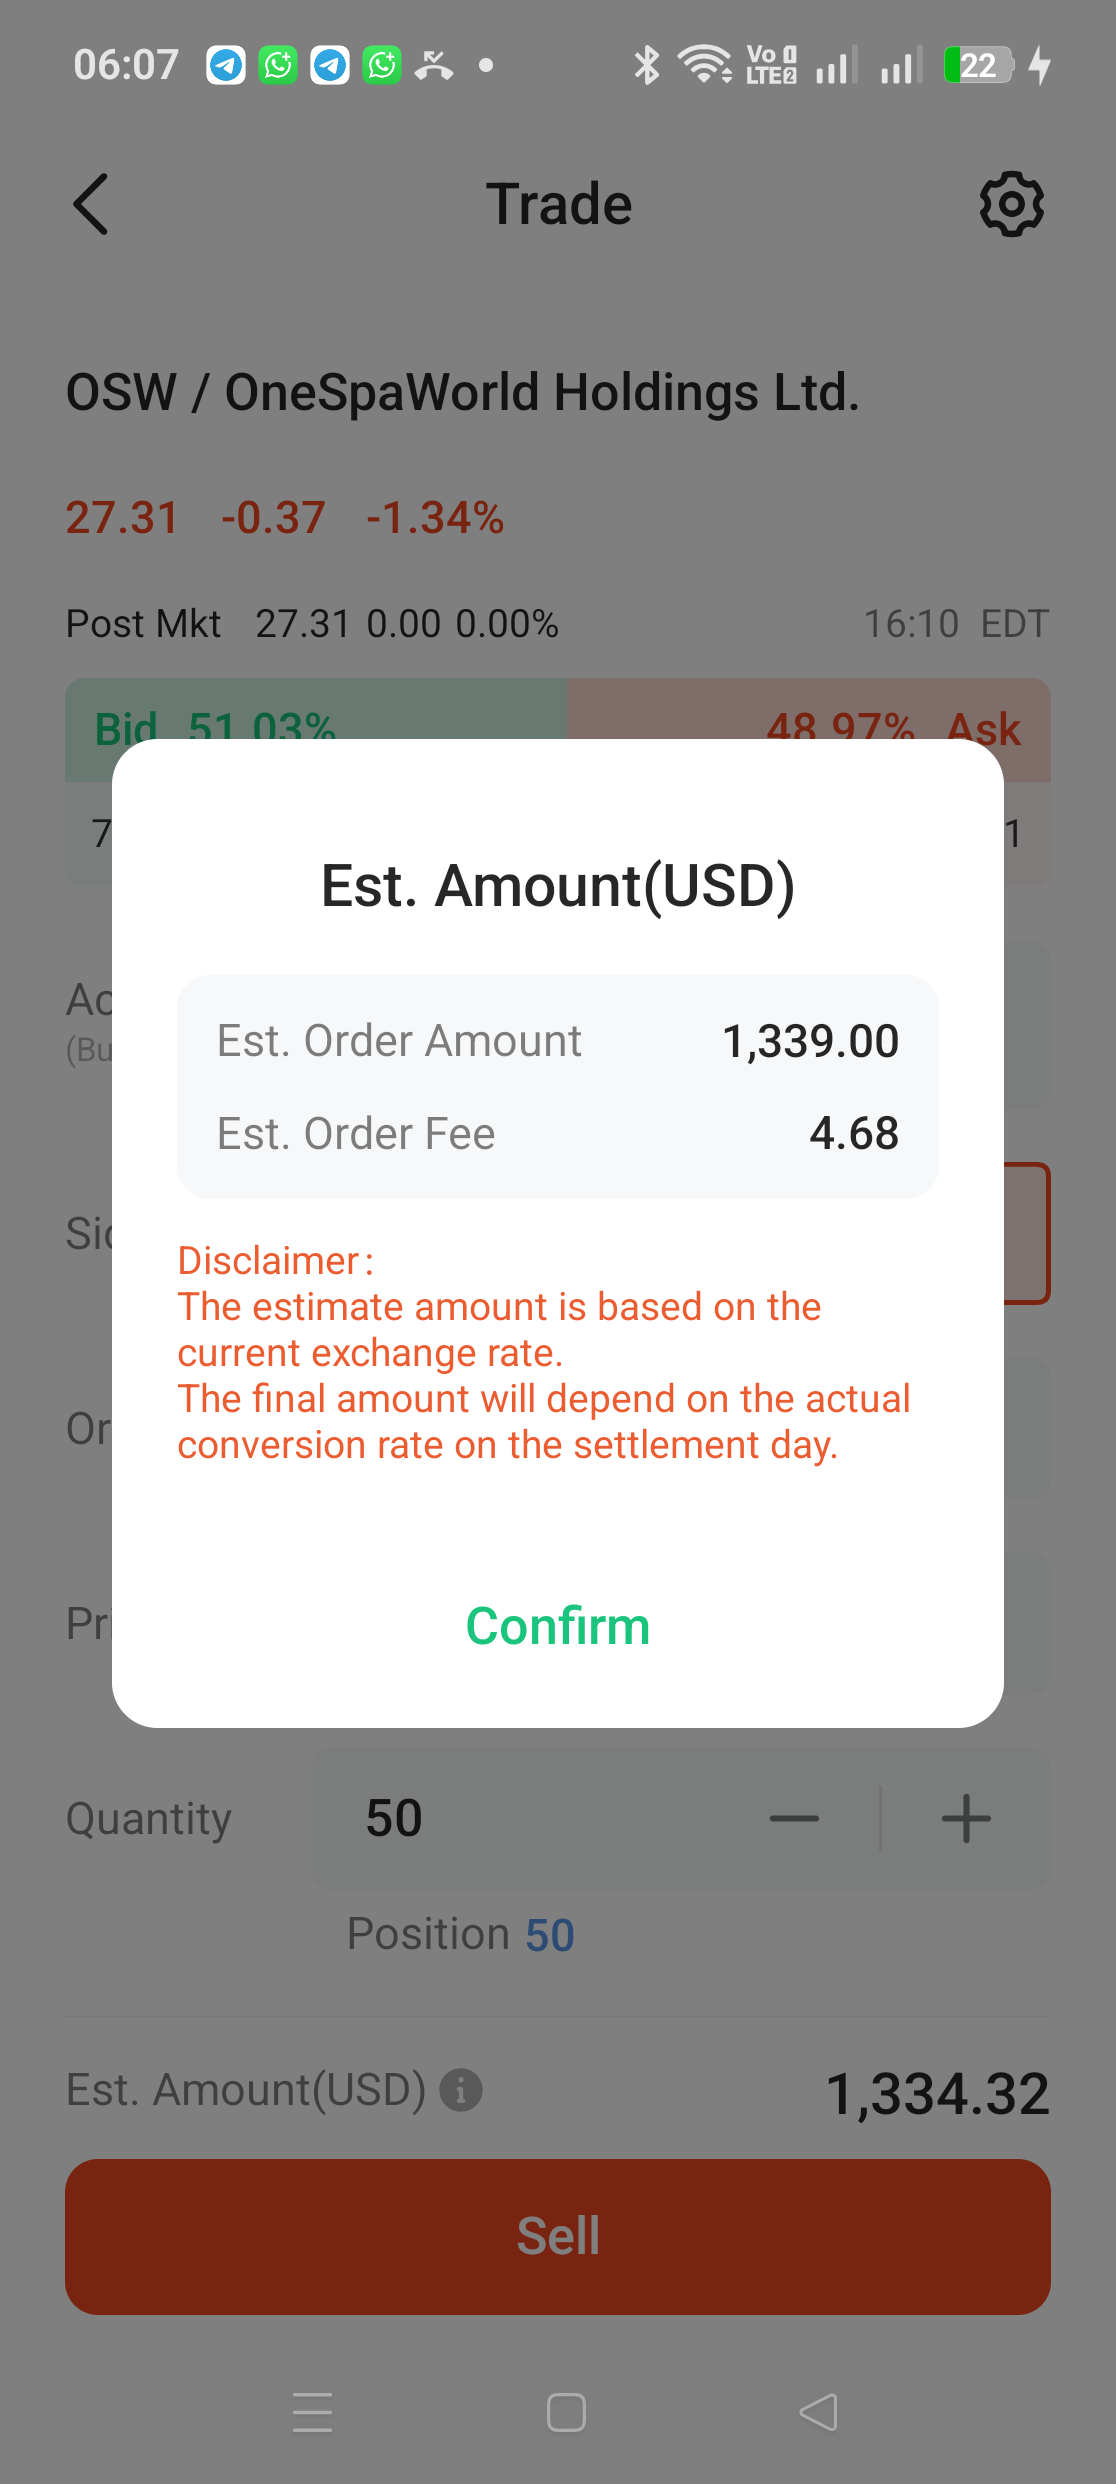
Tap the ⓘ icon next to Est. Amount and the app shows the estimated breakdown: gross sale proceeds of 1,339.00 (50 × 26.78), minus an estimated fee of 4.68, for net proceeds of USD 1,334.32. Yes - selling incurs fees too, just like buying. The full breakdown of every charge is in our article on M+ Global transaction fees.
Step 4: Review & Confirm
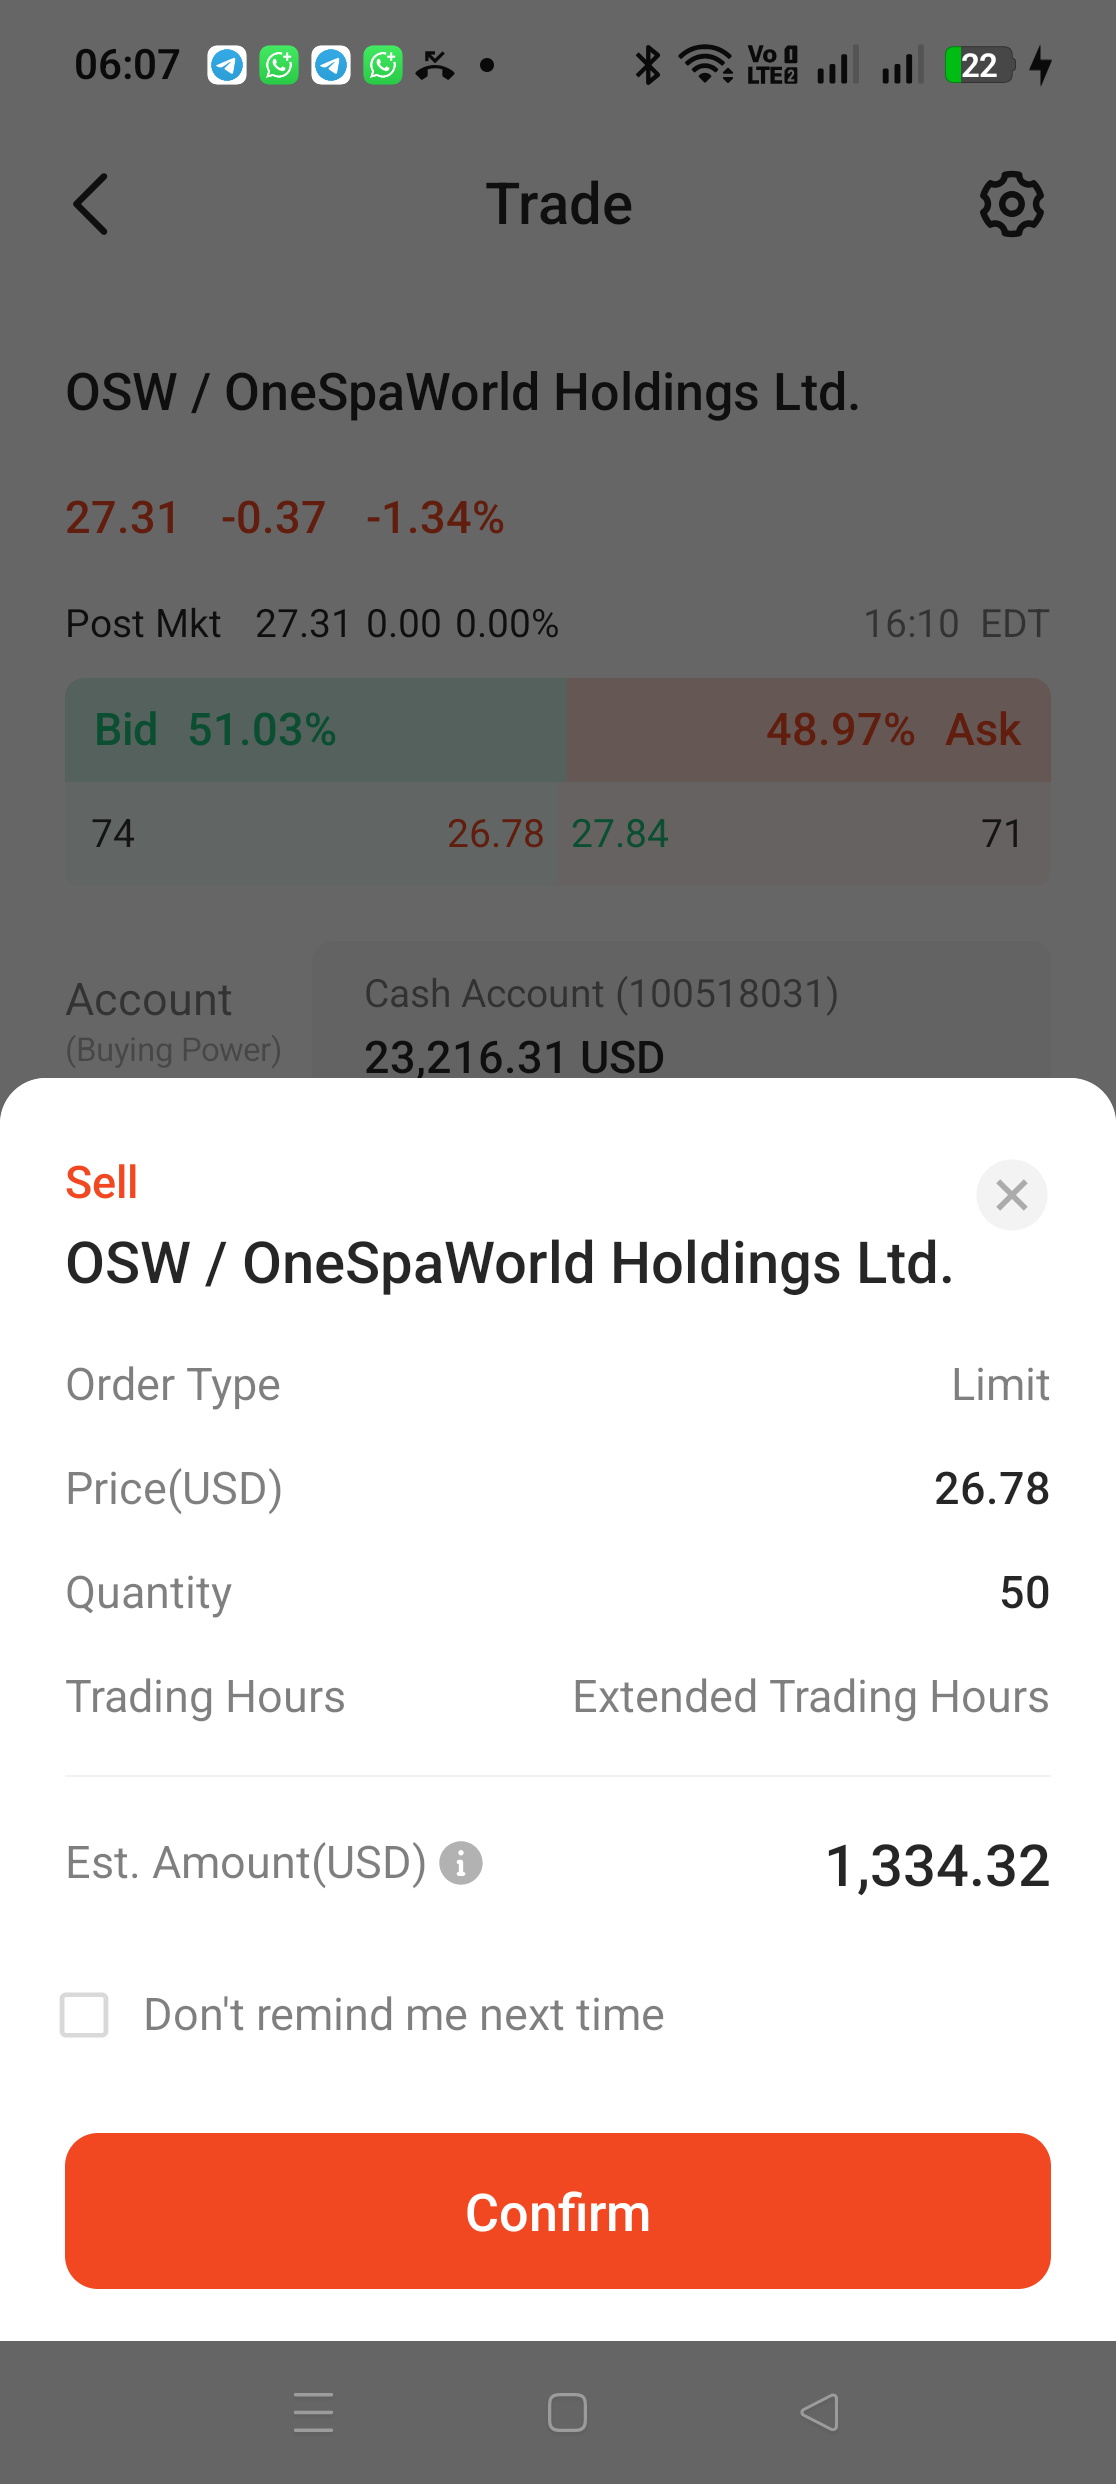
Tap the red Sell button and the confirmation screen appears: Sell, Limit 26.78, Quantity 50, Trading Hours: Extended Trading Hours (essential for the after-hours session - otherwise your order just sits until the regular market opens). Check everything, then tap Confirm.
Sold in One Second
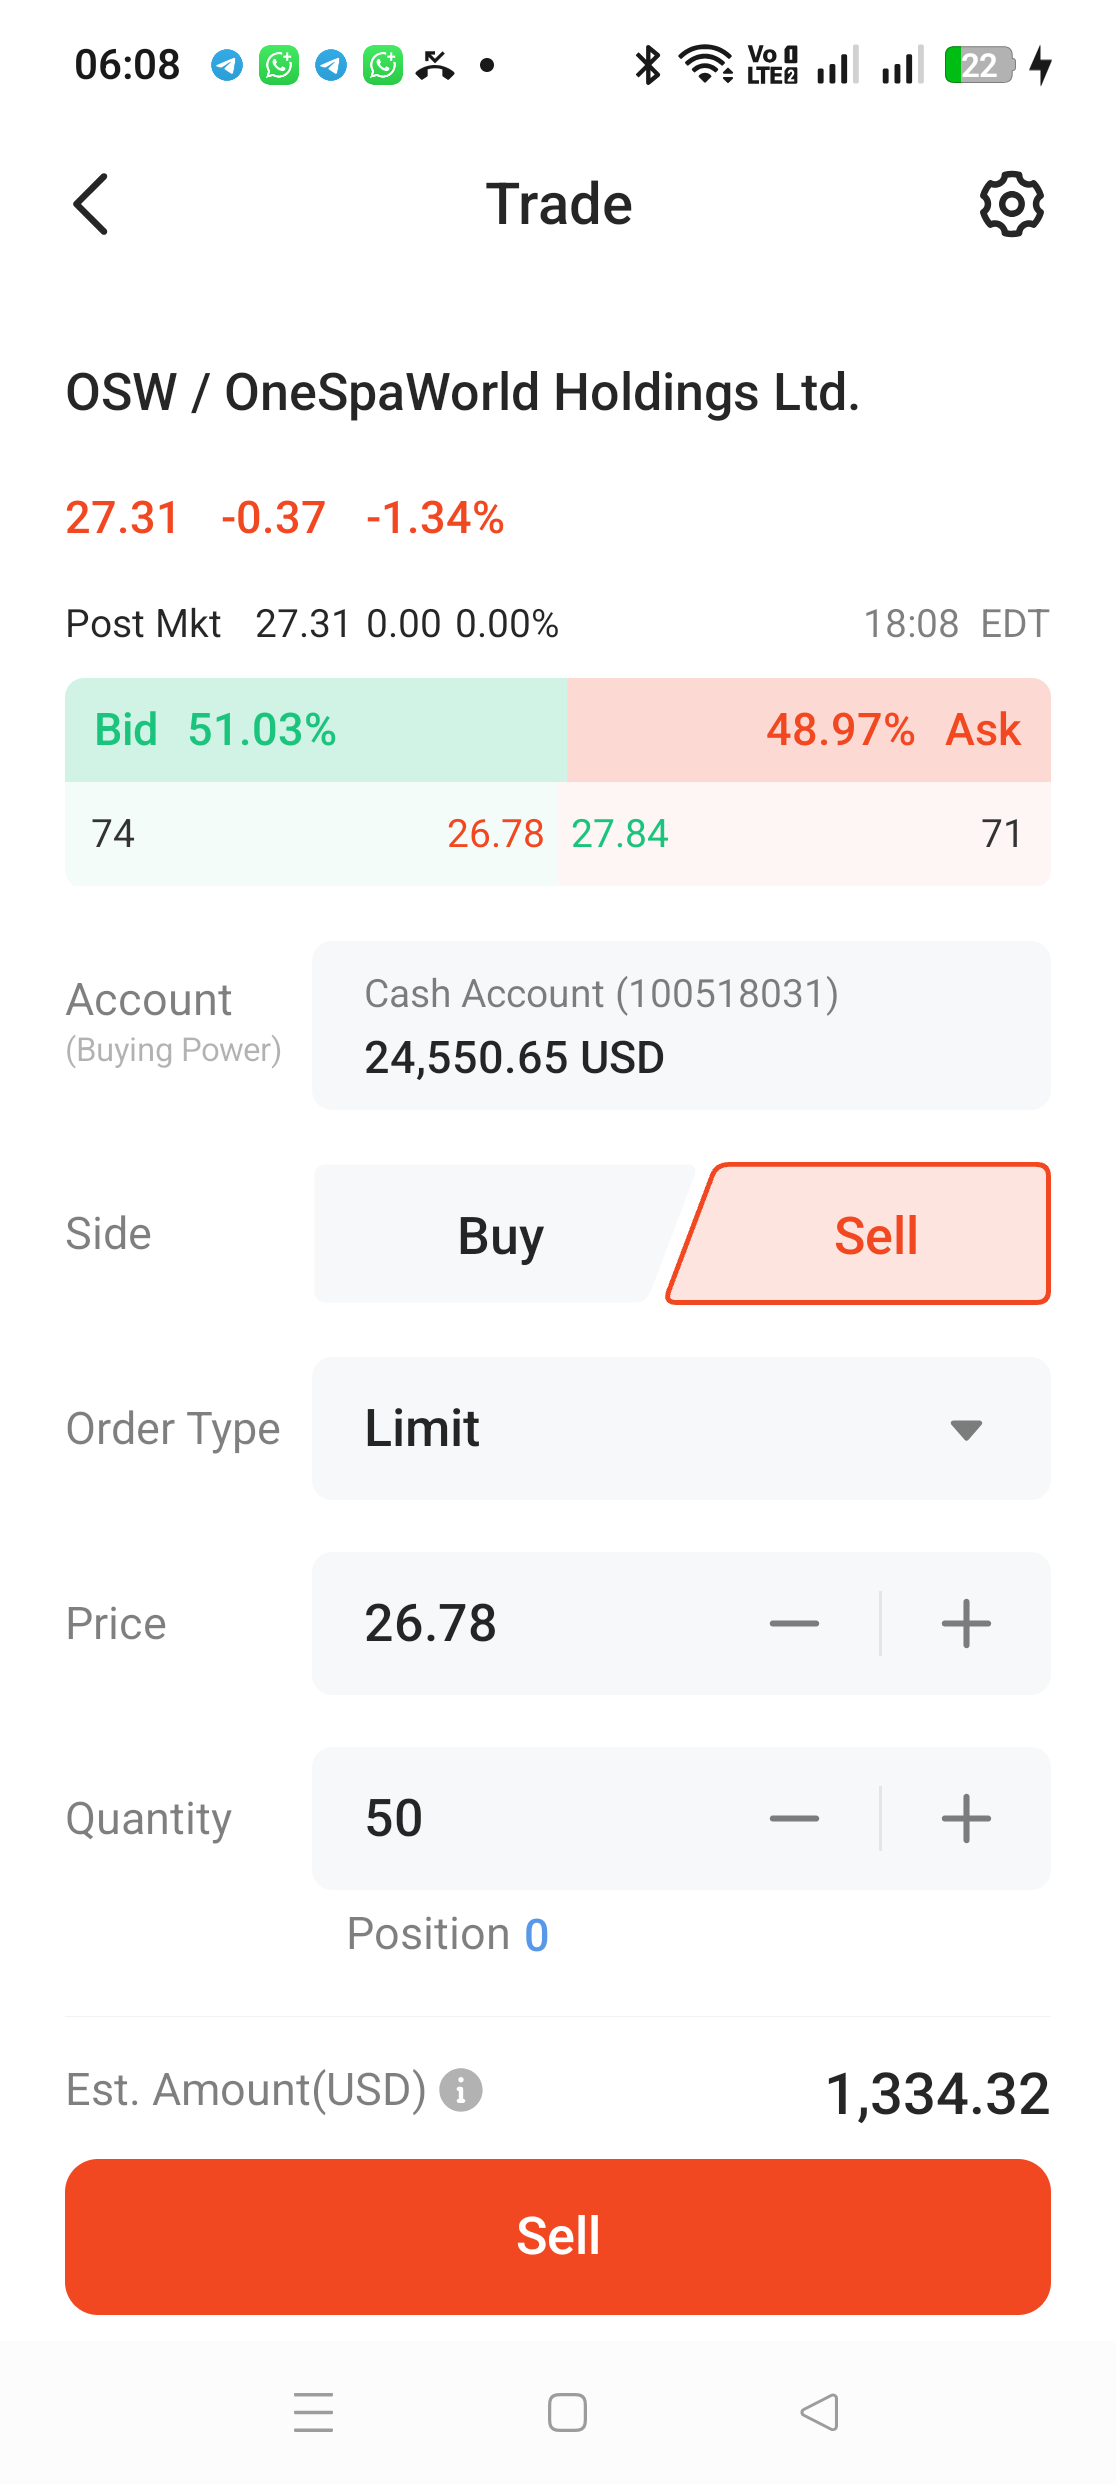
The moment Confirm was tapped, the "Order Filled" notification appeared - all 50 shares sold at 26.78. Because our order was placed exactly at the bid price, it matched instantly with the waiting buyers.
Notice Buying Power jumped immediately from 23,216.31 to 24,550.65 USD (+1,334.34). Sale proceeds can be used right away to buy other stocks.
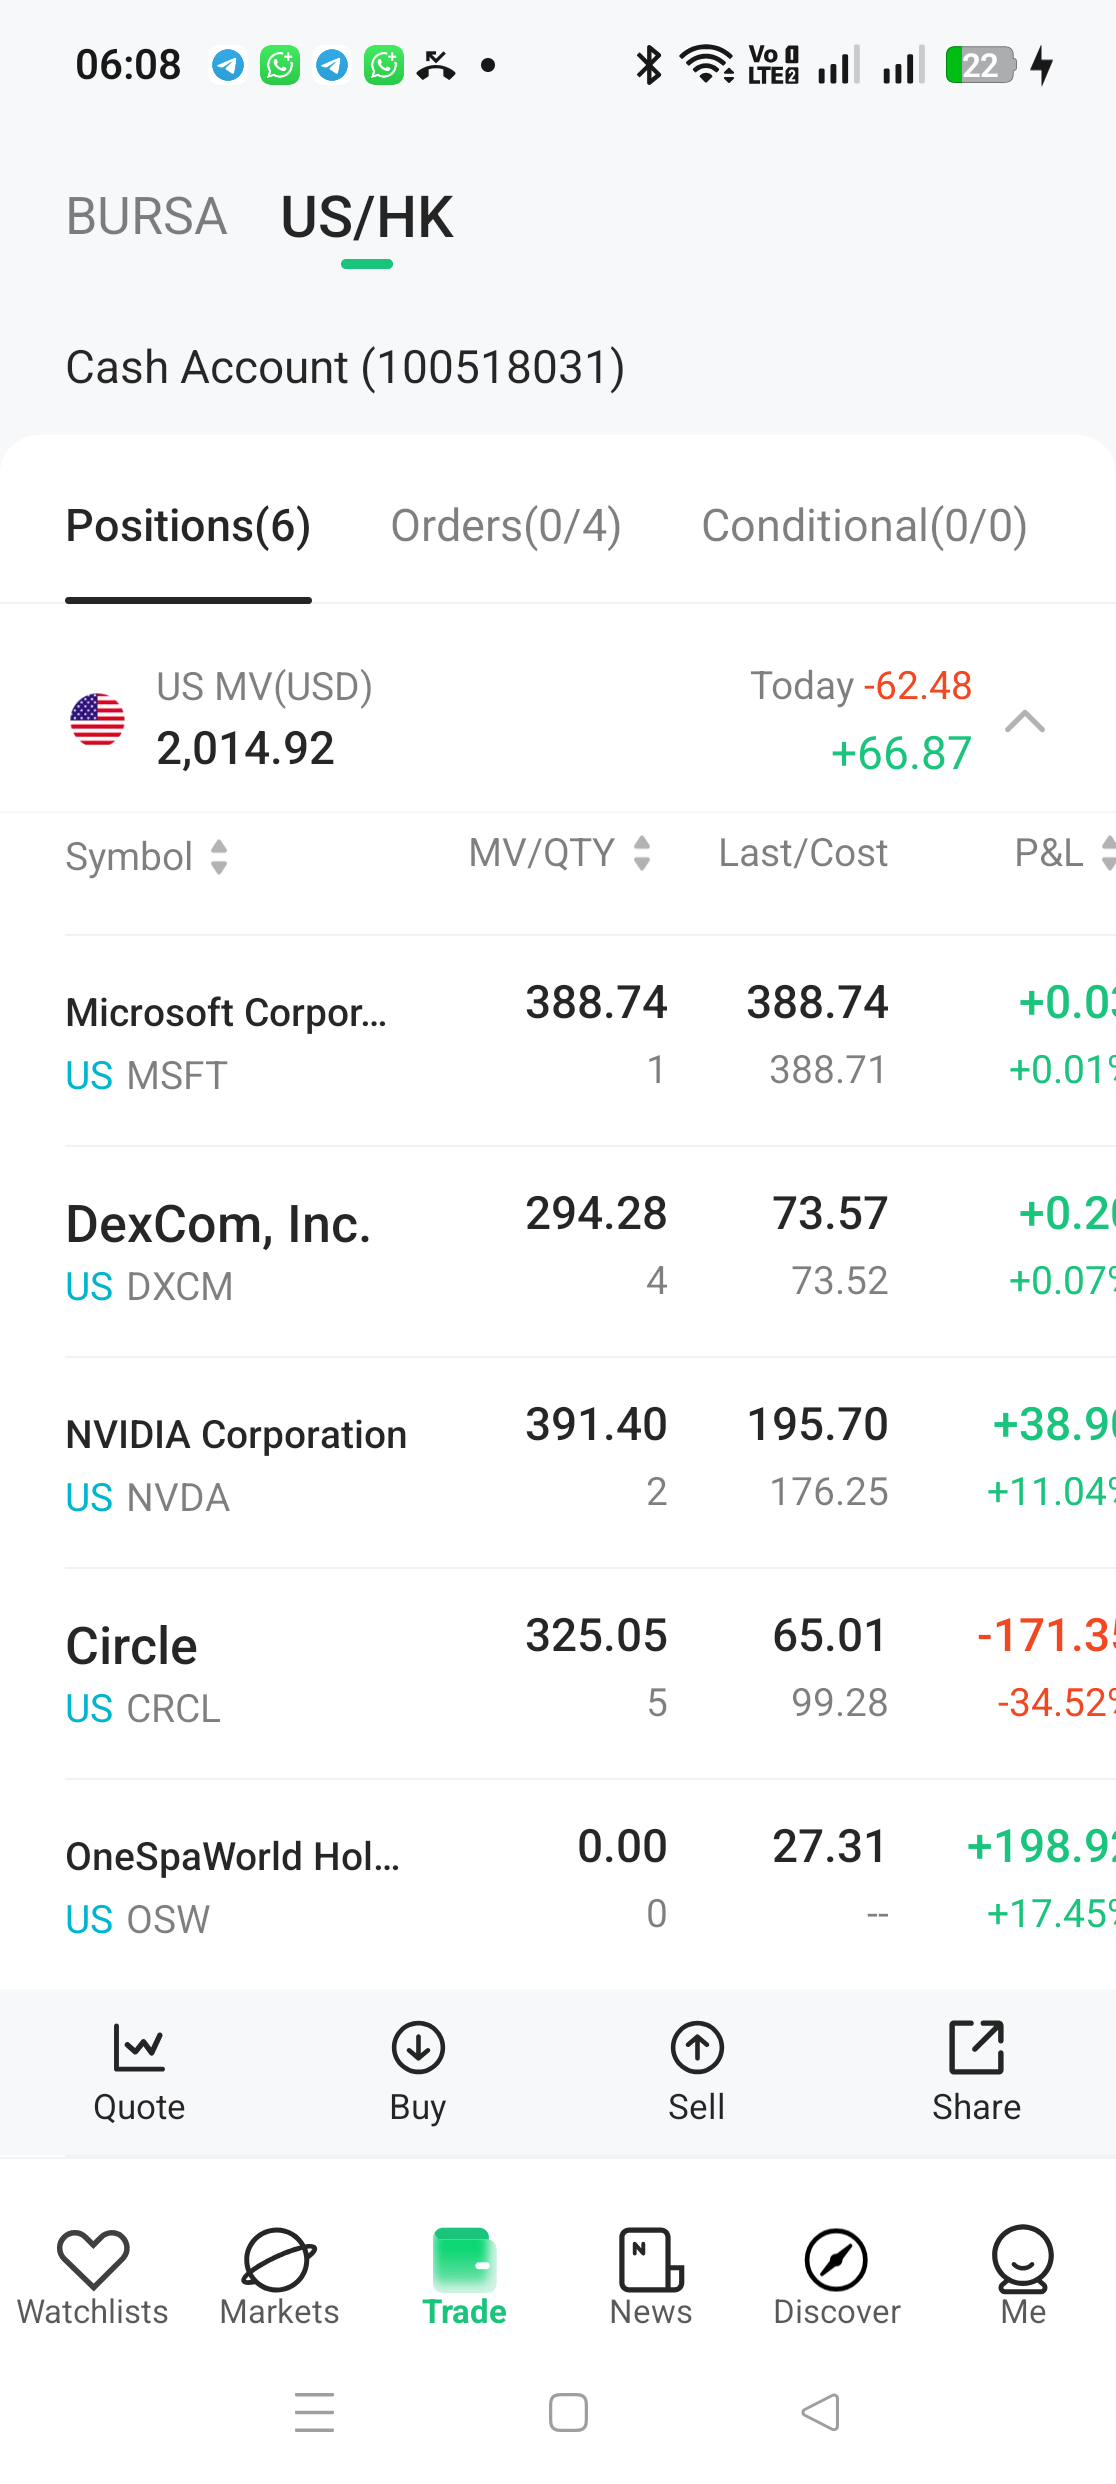
Back in Positions: OSW now shows QTY 0 with a P&L of +198.92 (+17.45%). Why 198.92 and not 208? Because this figure is net - it accounts for both the buy fee and the sell fee. That is the real profit in your pocket: 1,131 of capital → roughly 1,330 back, in just under 5 months.
Check the Order & Fee Details After Selling
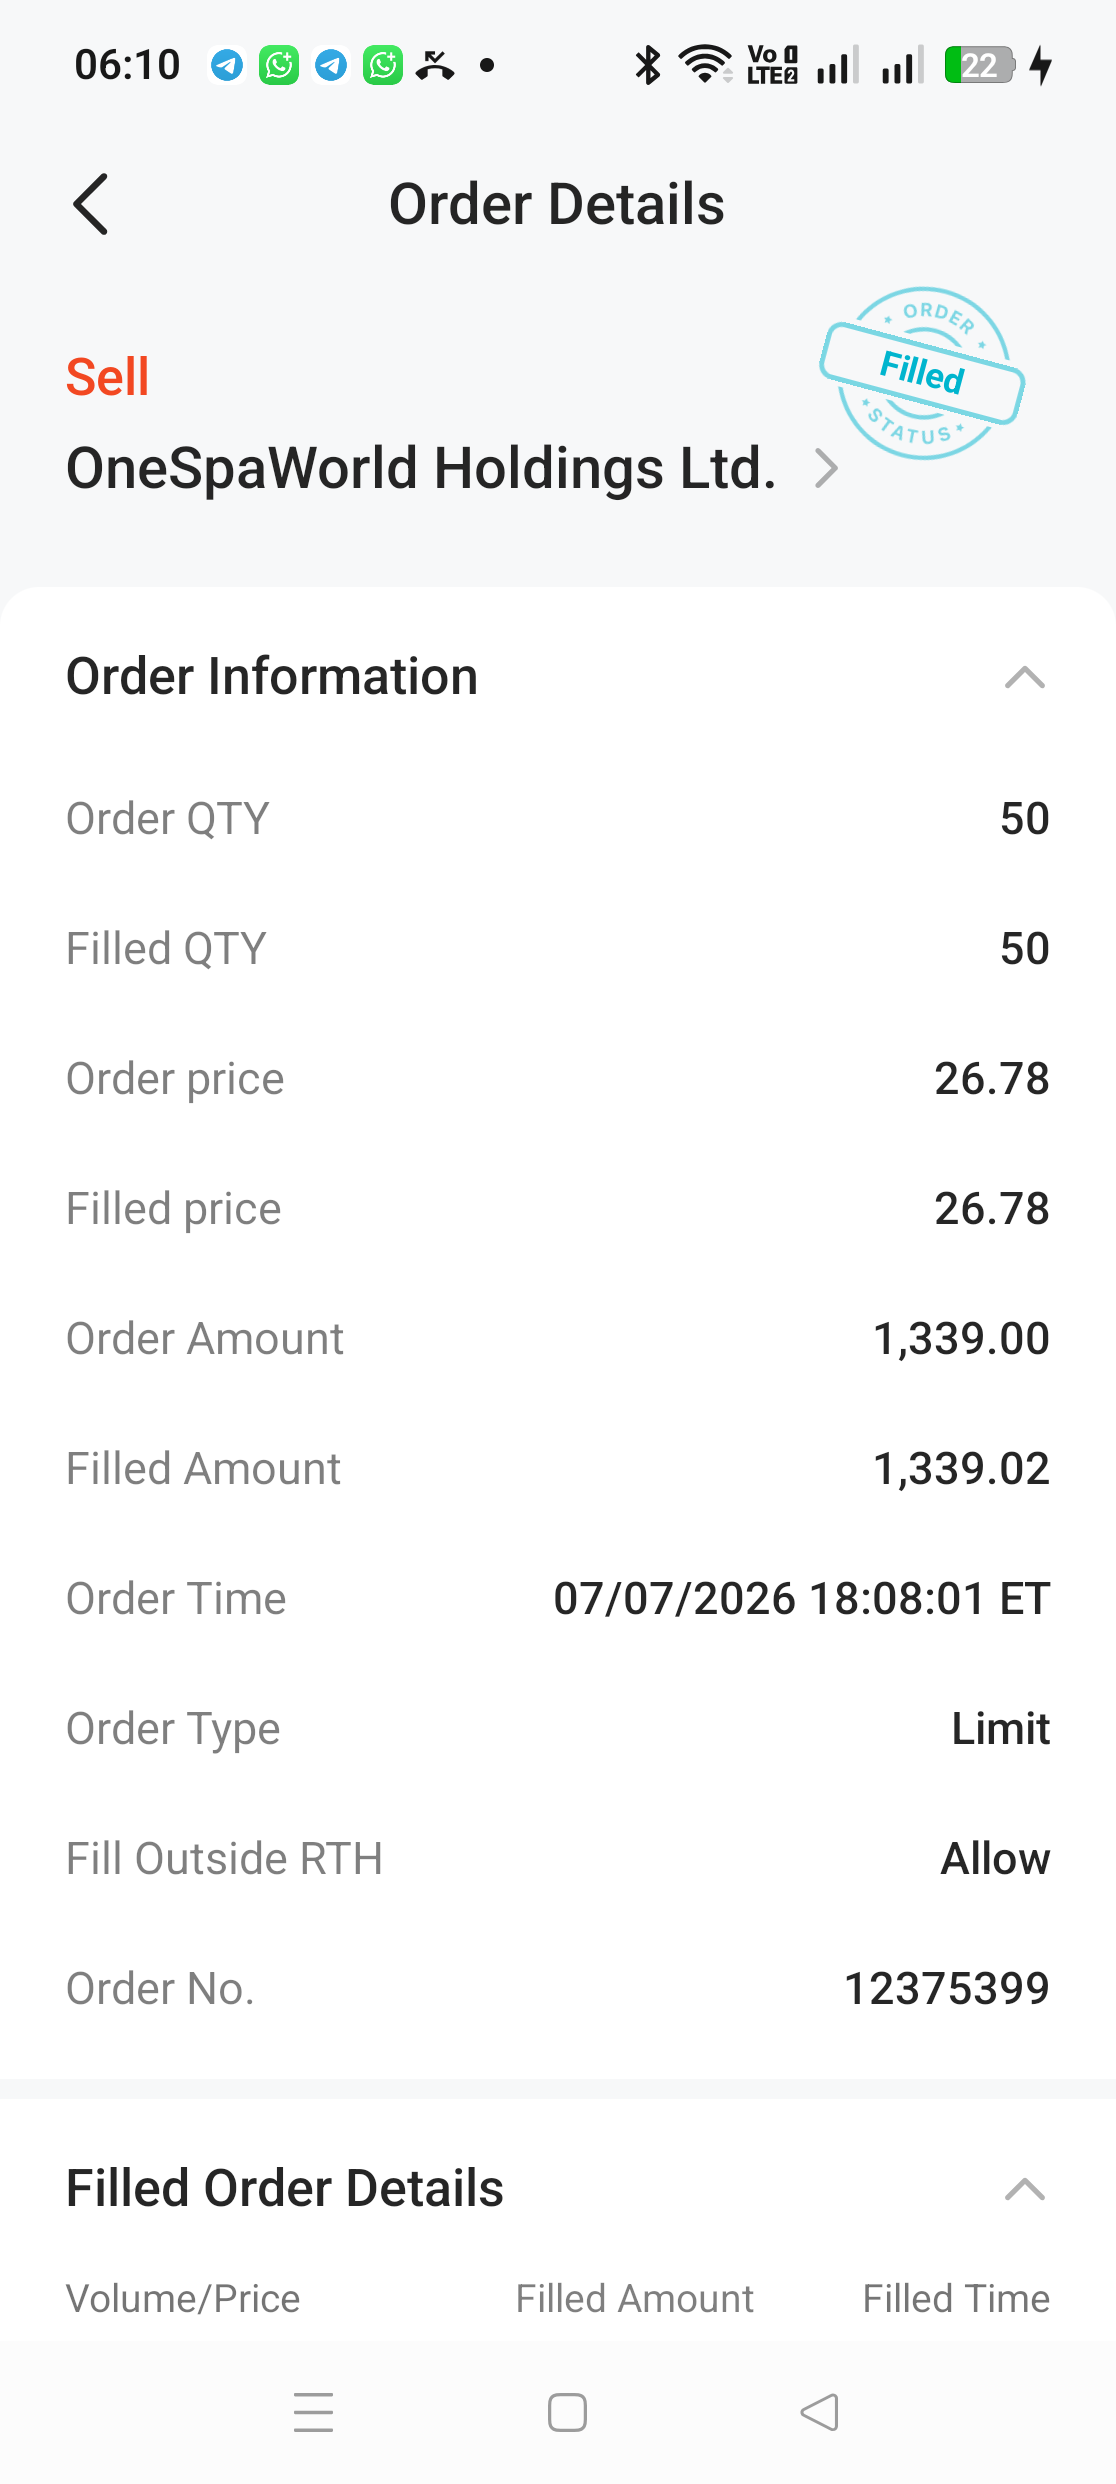
As usual, tap the order in Today's Order → Details for the full record: Filled price 26.78, Filled Amount 1,339.02, order time 18:08:01 ET, and "Fill Outside RTH: Allow" (the record of our Extended Hours setting).
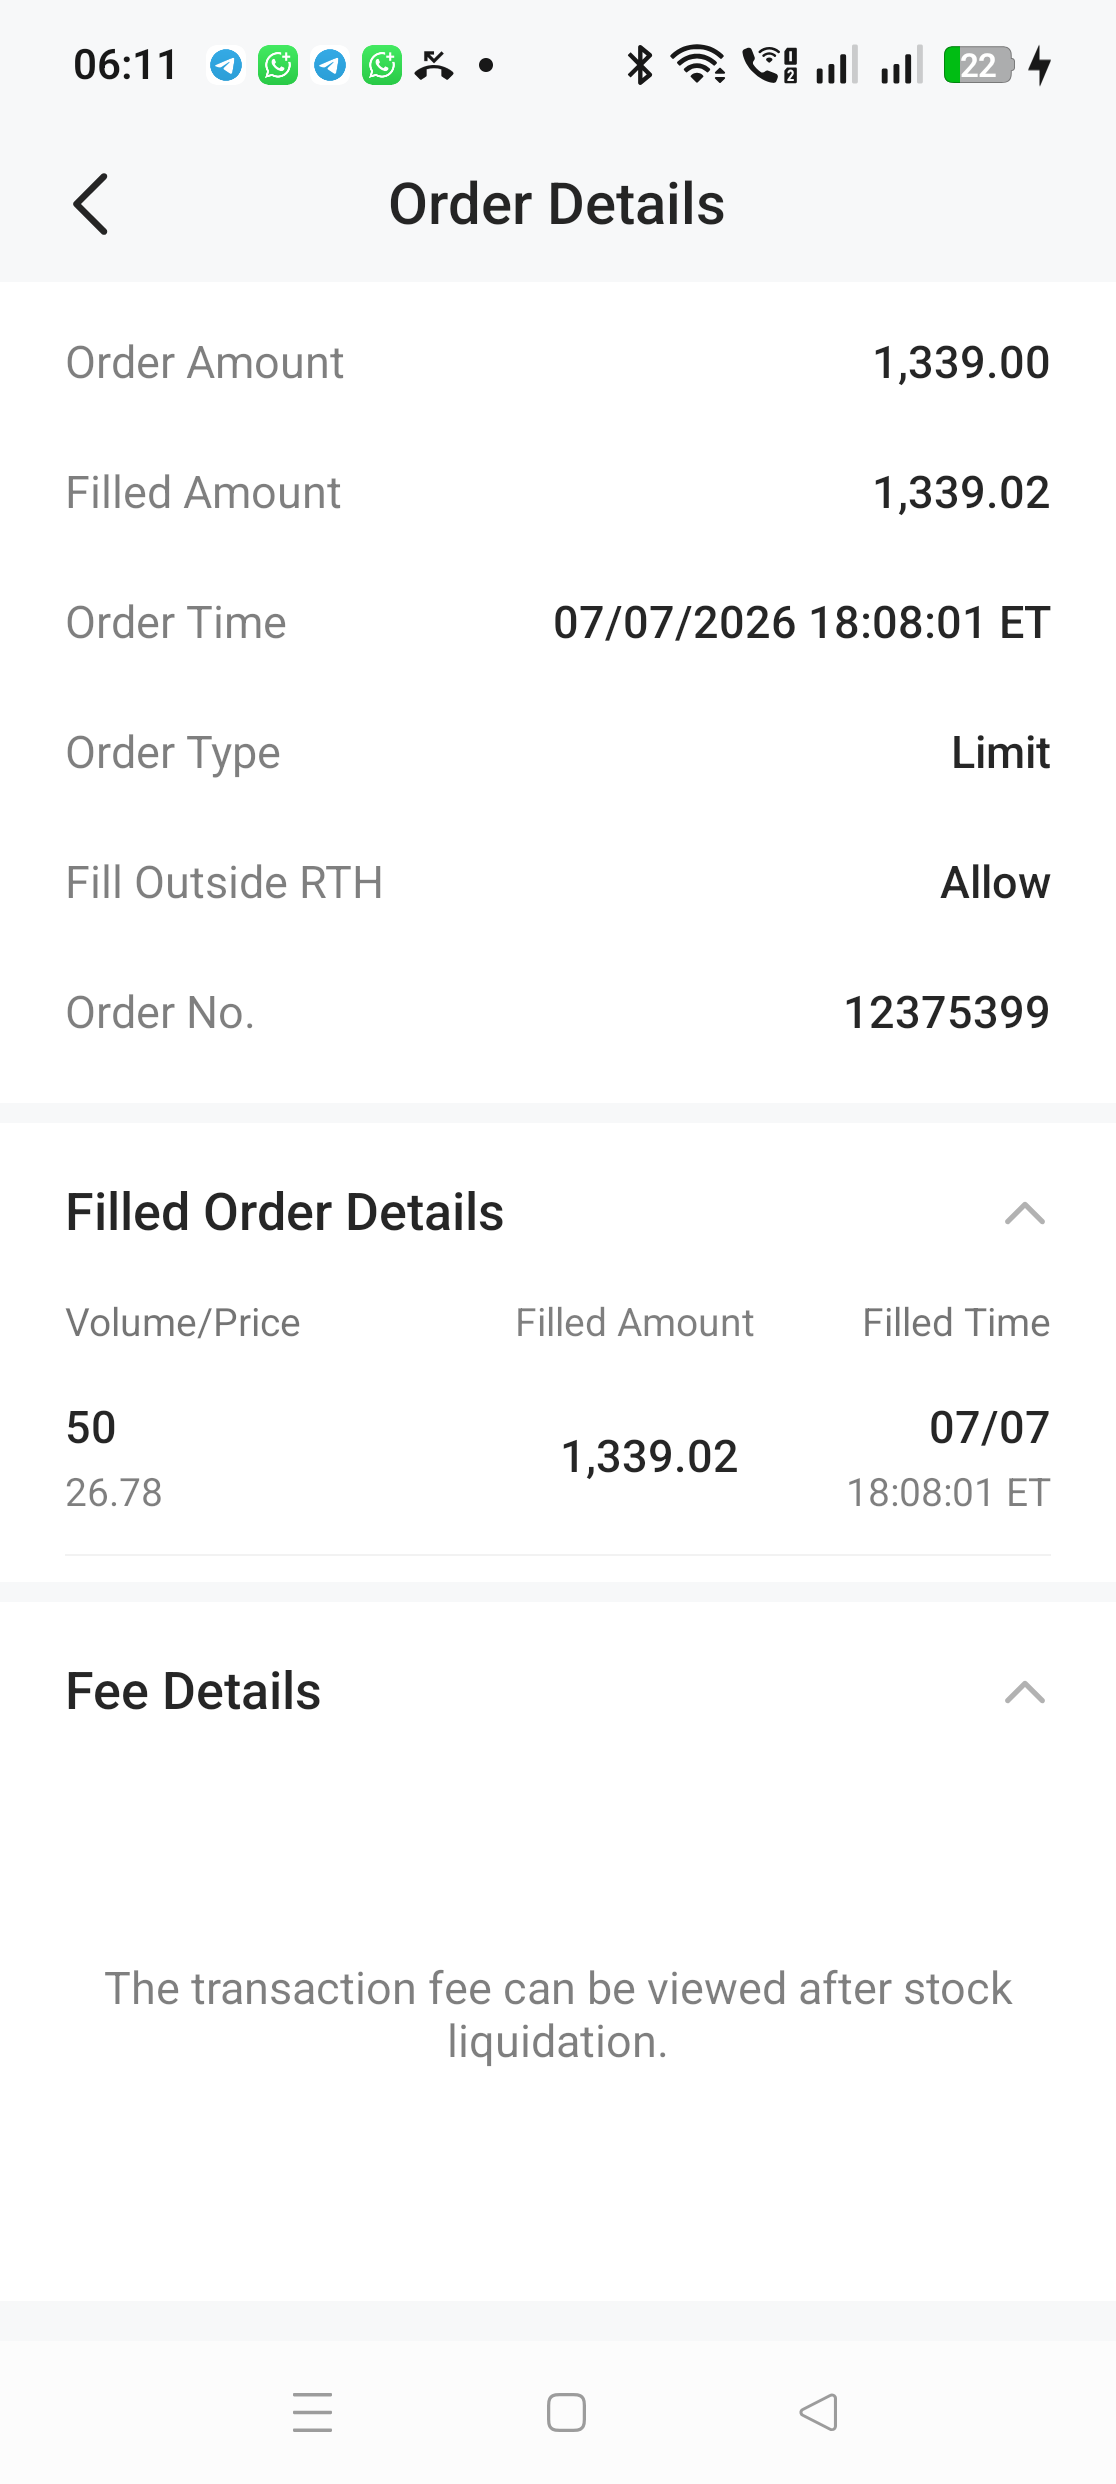
The Fee Details section shows the same message as when buying: "The transaction fee can be viewed after stock liquidation." The final fee breakdown appears after processing - check your daily e-statement the next day for the official numbers.
Your Profit Record: The Realised Profit Screen
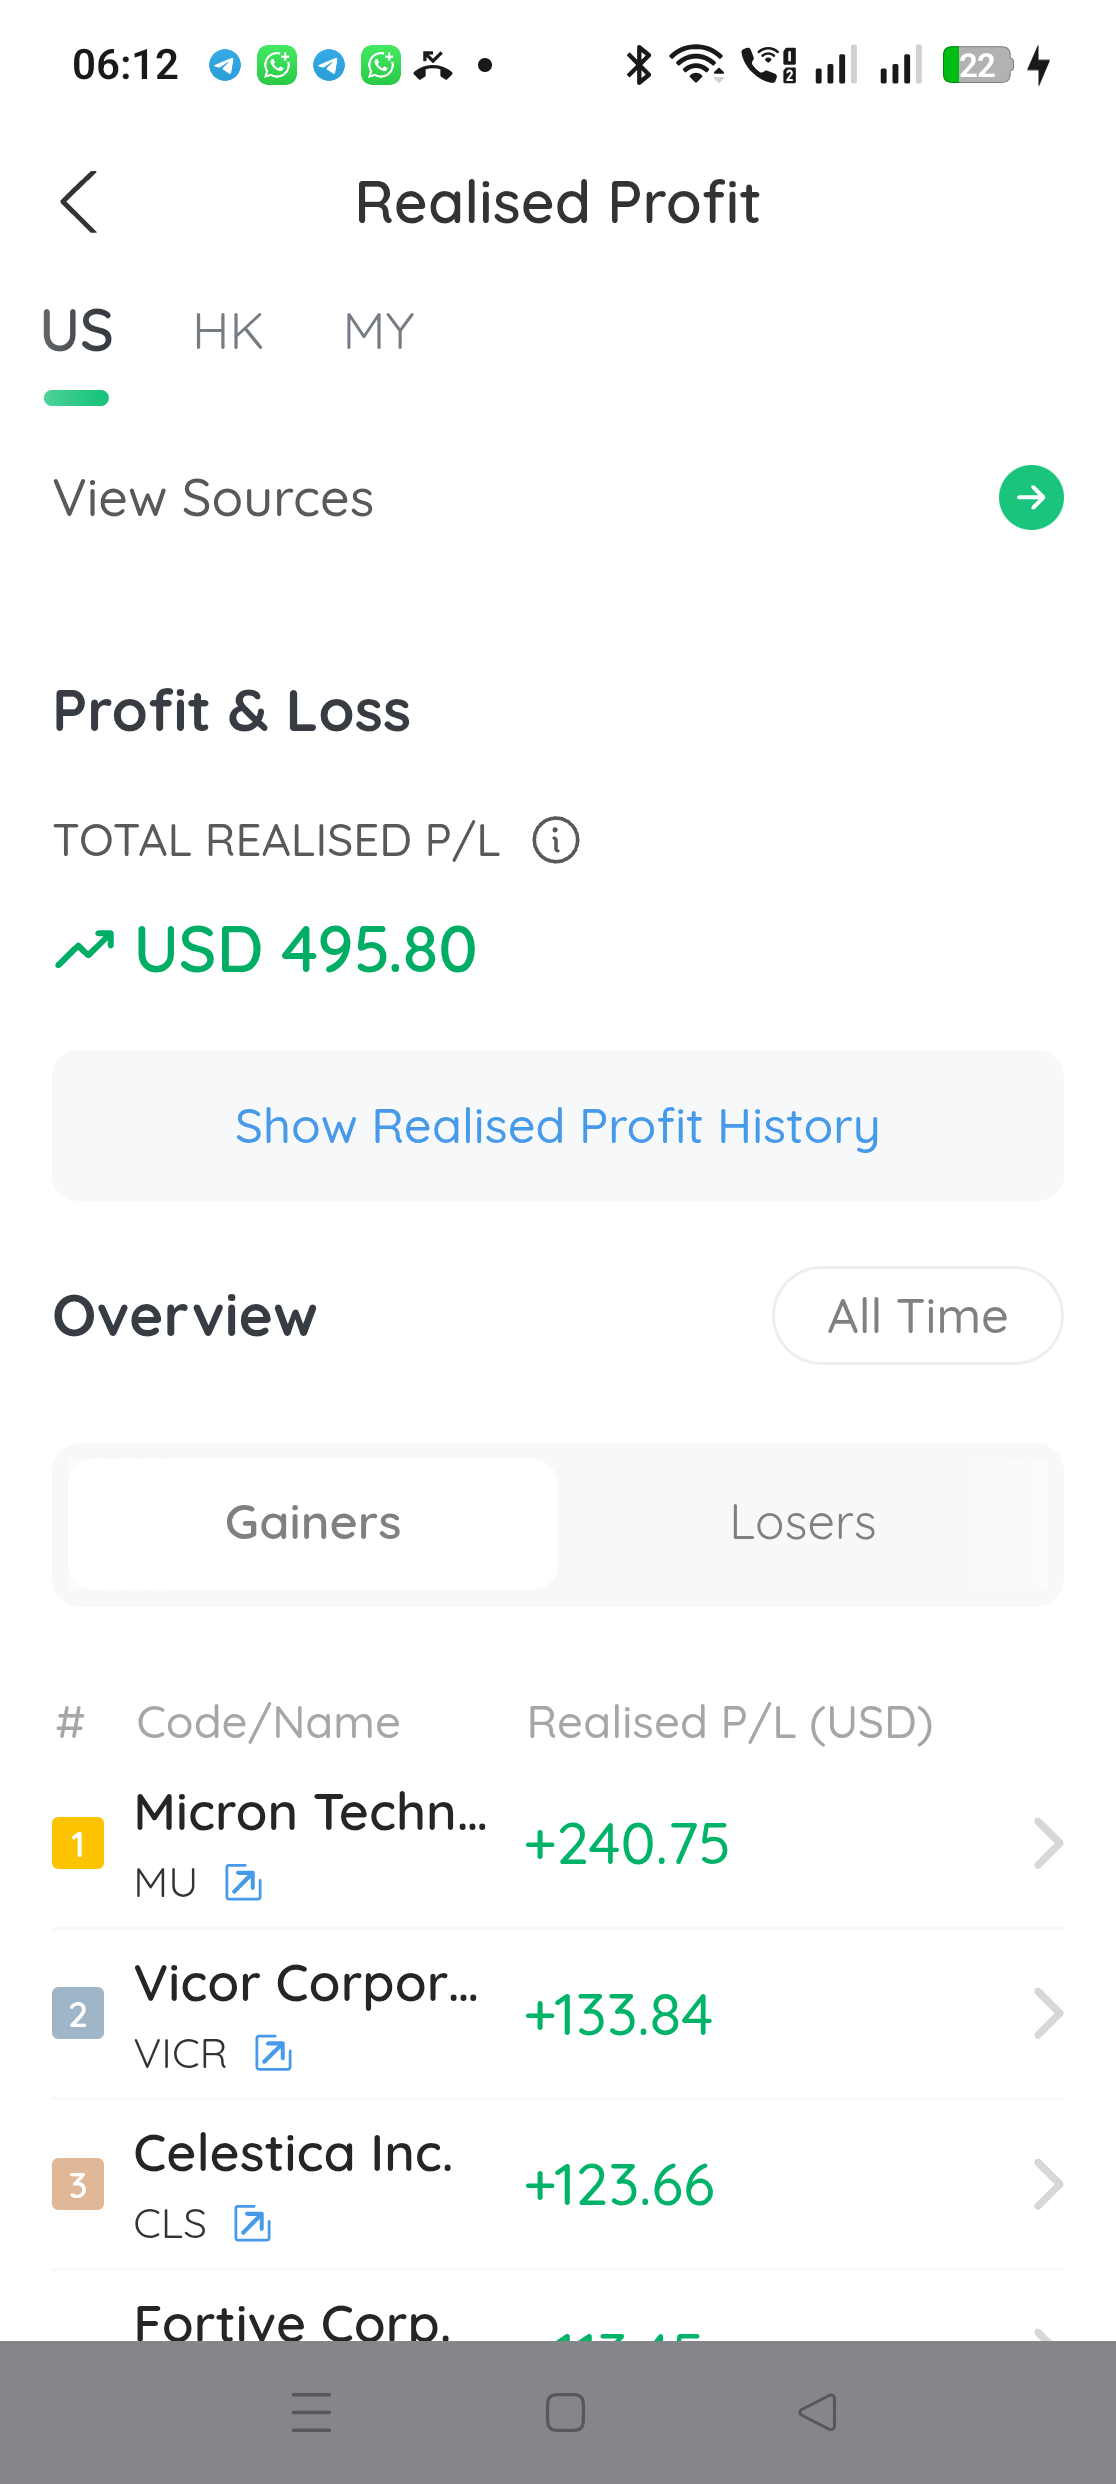
Finally, head back to the Trade dashboard and tap the Realised Profit icon. This screen keeps a record of every profit and loss you have realized (stocks already sold) - complete with a Gainers and Losers ranking per stock. It is a great tool for reviewing the quality of your buy and sell decisions over time.
Note: our OSW sale had not yet appeared in the list right after selling - this screen, like Fee Details, only updates after end-of-day processing. Don't panic if the numbers don't change immediately.
When Can You Withdraw the Money?
A common question: buying power rises instantly, but when does the money actually settle? The US stock market now runs on a T+1 settlement cycle as mandated by the SEC - one business day after the trade date. That means you can reuse sale proceeds for new purchases right away, but for a withdrawal, wait for settlement and factor in the USD-to-MYR conversion process if you are withdrawing in Ringgit.
5 Important Tips Before Selling US Stocks
- Understand that your P&L is computed at the Last price - your actual sale price depends on the available bid. During after-hours, the gap can be large.
- Want an instant sale? Limit = Bid. Want a better price? Set a higher limit and be willing to wait, or sell during regular hours.
- Use the "Position" link to auto-fill your full holding - avoids quantity typos.
- Check Historical Orders before selling if you are unsure of your purchase cost - especially after multiple buys.
- Fees and Realised Profit update late - final figures appear after processing; check the next day's e-statement. Don't confuse them with the immediate post-sale display.
Frequently Asked Questions (FAQ)
How do I know my profit before selling?
Look at the P&L column in the Positions tab: (Last − Cost) × quantity. But remember, that is based on the last traded price - your actual proceeds depend on the bid price at the moment you sell.
What do Last and Cost mean in my portfolio?
Last is the stock's most recent traded price in the market. Cost is your average purchase price (across all purchases if you bought multiple times). Your profit is the difference between the two.
Why hasn't my sell order filled after a long wait?
Most likely your limit price is above the current bid - no buyer is willing to pay that price yet. Lower your limit to the bid level for an immediate sale, or wait for the market to rise to your price.
Can I sell only part of my holding?
Yes. Simply type the quantity you want in the Quantity field - you don't have to sell everything. The remaining shares stay in your portfolio at the same cost.
When does the sale money arrive and when can I withdraw it?
Buying power increases instantly after the fill and can be reused for new purchases. For withdrawals, the US market uses T+1 settlement (one business day), and the withdrawal process to a Malaysian bank takes additional time including currency conversion.
Why is my realized profit lower than the P&L I saw before selling?
Two reasons: first, you may have sold at a bid below the Last price (especially during after-hours with wide spreads). Second, buy and sell fees are deducted from the gross profit.
Is profit from selling US stocks taxed?
Capital gains from selling US shares are not taxed at the US level for foreign investors. Dividends are different - they are subject to 30% withholding tax (IRS NRA withholding). For your Malaysian tax position, consult a tax adviser.
Where can I see all my past realized profits and losses?
Trade dashboard → the Realised Profit icon. That screen shows your total realized P/L and a per-stock ranking (Gainers/Losers), plus the full history via "Show Realised Profit History".
Conclusion
Selling a US stock in M+ Global takes just four steps: check Positions (understand Last/Cost/P&L), open the sell ticket from the stock row, set your limit at the bid price for an instant sale, and confirm. Our demo: 50 shares of OSW sold in one second with a net profit of +198.92 USD (+17.45%) after almost 5 months of holding. Most importantly: understand the difference between the on-screen P&L and the profit you actually realize - spreads and fees make the difference.
The full buy-hold-sell cycle starts with the right account.
Open a CDS trading account with us for access to Bursa Malaysia as well as foreign stocks such as the US and Hong Kong markets in one account.
New to stock investing? Download our Stock Market Basics Ebook for free.