Stock Sector Analysis on Bursa Malaysia

Understanding how stocks move within sectors is a fundamental skill for any investor on Bursa Malaysia. In this guide, we will explore how to analyse stocks based on their sector, why sector analysis matters, and how big players influence price movements across different sectors.
What Is a Stock Sector?
A sector refers to a specific area or field of business activity. In the stock market, companies are grouped into sectors based on the industry they operate in.
The main sectors listed on Bursa Malaysia include:
- Technology
- Industrial Products & Services
- Telecommunications
- Finance
- Property
- Construction
- Consumer Products & Services
- Energy
- Health Care
- Transportation & Logistics
Why Is Sector Analysis Important?
Yes, understanding sectors is essential for investors.
Stocks within the same sector tend to move together — some as leaders (moving first) and others as laggards (following later). The key point is that counters within a trending sector will experience price movement.
Big players, fund managers, syndicates, and institutional investors typically focus their capital on specific sectors at any given time.
For example, during the Covid-19 pandemic, these big players focused on sectors related to personal protective equipment — companies producing face masks, gloves, and hand sanitisers saw massive price movements.
As Malaysia rolled out its national immunisation programme, interest in Covid-related sectors gradually subsided, and big money began rotating into other sectors.
How Long Do Sector Trends Last?
Sector-driven price movements typically last two to three months. If a particular issue is strongly trending, the movement may extend to around six months. It rarely lasts one to two years.
Usually, counters within a sector will rise for a period before the market rotates to a different sector.
Who Moves Stock Prices?
The entities that truly move stock prices are those with substantial capital — big money, fund managers, syndicates, and institutional investors.
Retail investors like us cannot move stock prices the way they do. Even if many retail investors band together, the impact is minimal. Ultimately, it is the big players who drive price movements.
As retail investors, we need to follow them — but follow wisely.
We take advantage of their entry into a particular sector. If we follow without proper analysis, we risk getting caught at the top.
This is why it is crucial to understand market sentiment before buying or selling stocks.
Big players typically observe the prevailing market sentiment. Imagine they already hold positions across several sectors. When the technology sector starts trending, they enter multiple counters within that sector.
As prices gradually rise, retail investors start buying in. Once prices reach a certain high, big players begin selling their holdings. Prices then fall, and retail investors who entered at the peak suffer losses.
The lesson: retail investors must follow wisely and be aware of which sectors are controlled by big players. Avoid falling into traps.
How to View Sectors on Bursa Malaysia
Getting sector information is straightforward.
Log in to your trading platform. Go to mplusonline.com, enter your username and password.
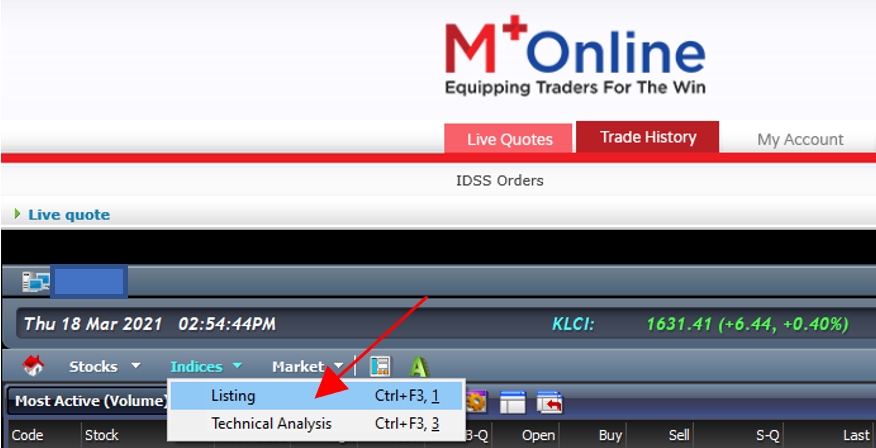
Then click Indices > Listing as shown in the image above.
A display like the one below will appear on your screen.
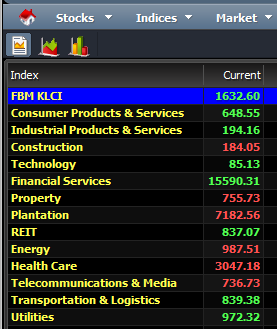
These are the sectors available on Bursa Malaysia.
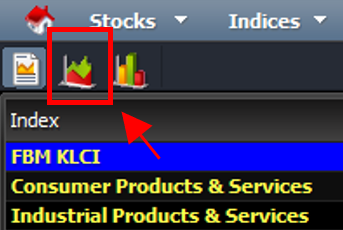
You can also access this information on the Mahersaham App. Simply log in to app.mahersaham.com, and you will be redirected to the home page.
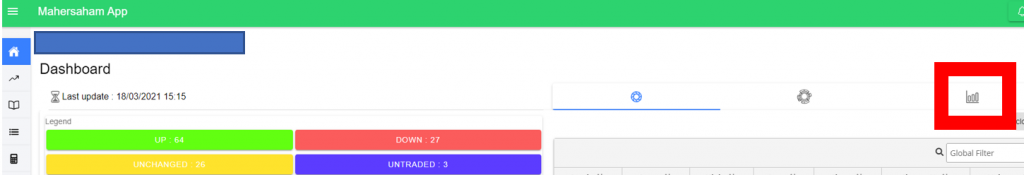
Click the bar graph icon highlighted in the red box above.
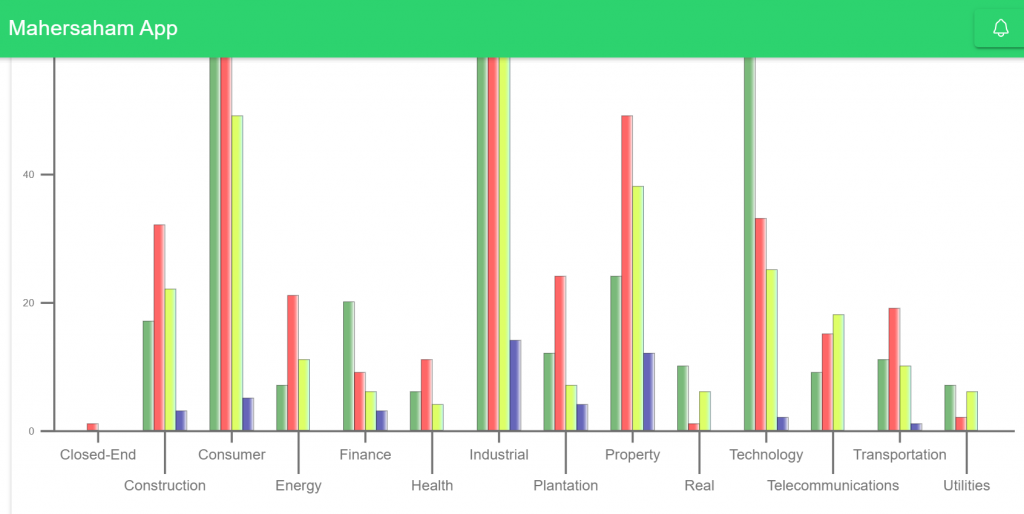
You can now view the full list of sectors on Bursa Malaysia.
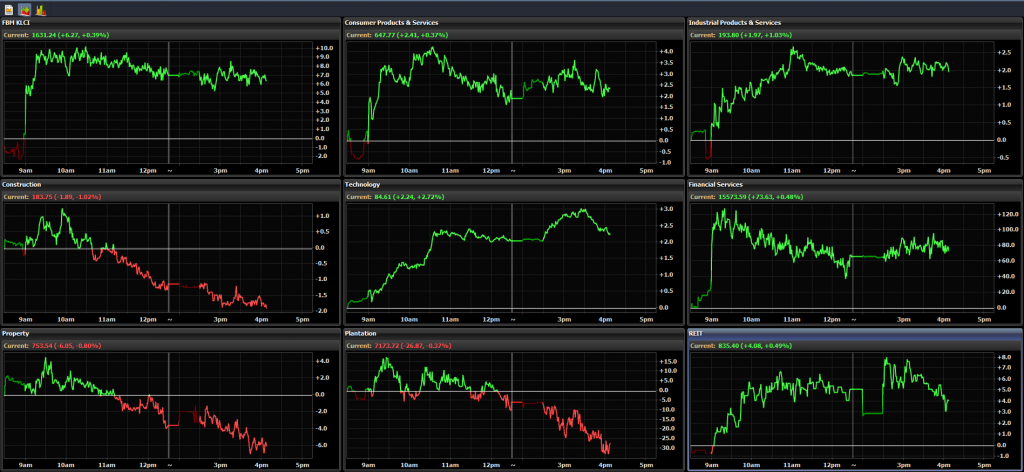
Going back to the Mplus platform, you can also view stock price movements for each sector. Click the second icon as shown below.
After that, the display will look like this. You can clearly see how stocks within each sector are moving (rising or falling) for the day and directly compare performance across sectors.
Let us take one sector as an example.
Technology Sector
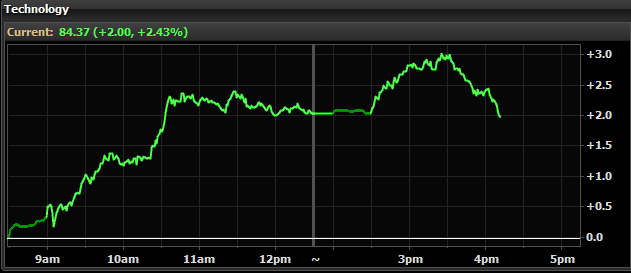
This shows the stock movement for a single trading day.
At the market opening at 9 AM, most counters in the technology sector experienced price increases until around 11 AM. The sector then traded sideways until the lunch break at 12:30 PM to 2:30 PM.
When the market reopened at 2:30 PM, stocks in this sector continued to rise until 3 PM. By early 3:30 PM, prices began to dip slightly.
This is how you can observe stock movements through sector analysis.
Keep in mind that any changes (increases or decreases) in a sector''s index are caused by price changes of the individual counters within that sector. The more counters rising within a sector, the more the sector''s line chart trends upward.
If you want more detail, you can double-click the sector you are interested in studying.
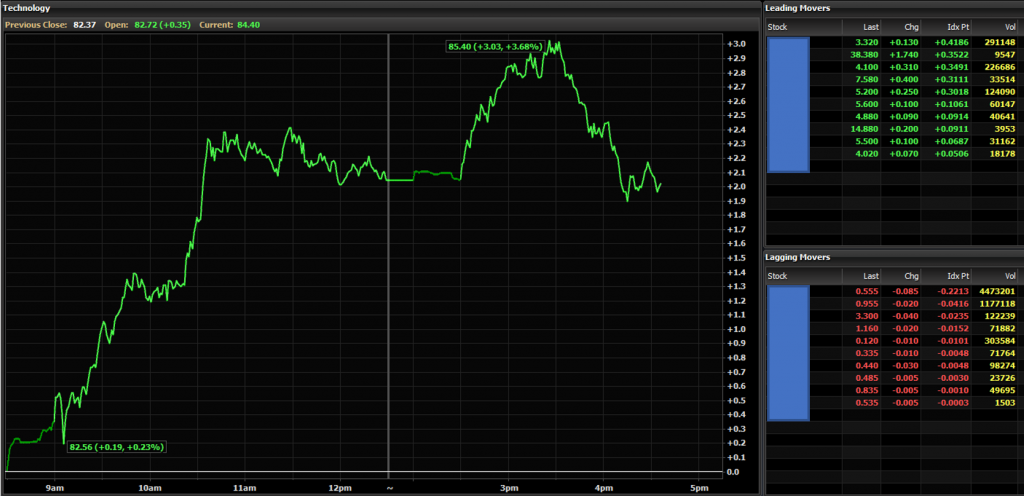
From the display above, you can identify the leader and laggard counters within any sector. Refer to the right side of the image above.
Sector Trend Analysis
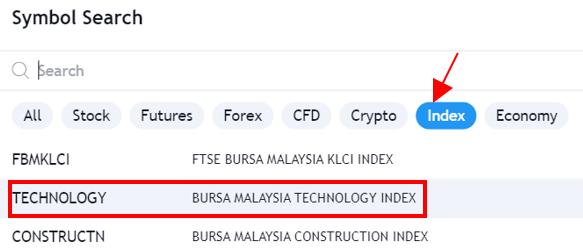
First, go to tradingview.com and click on the chart.
Then search for the index and select the sector you wish to analyse. In this example, we will select the technology sector.
Next, break the sector chart down by year. Your chart will then look like this:
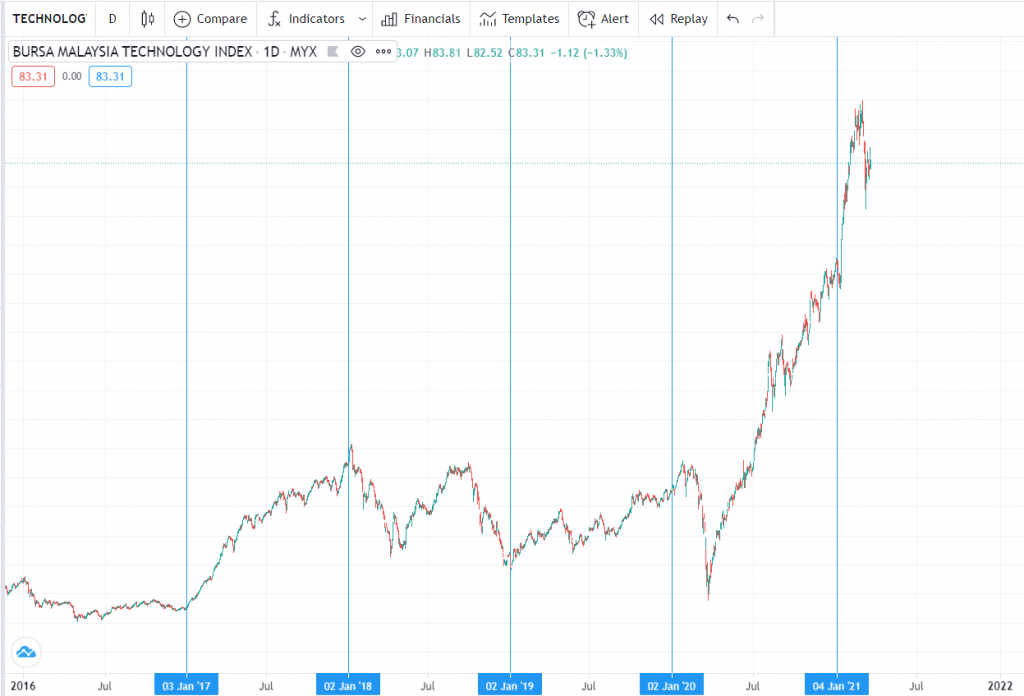
Why do this? So that we can see how stock prices within a sector move from the beginning to the end of each year.
For this lesson, we will analyse four years of data. You can extend this analysis to as many years as you prefer.
What can we analyse from the chart above?
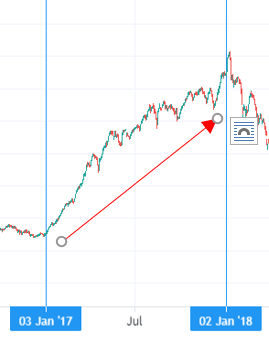
From early to late 2017, the technology sector was in a clear uptrend.
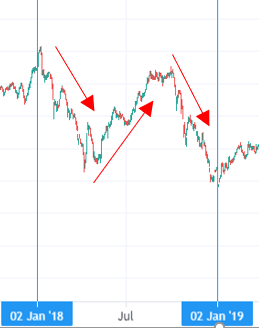
In contrast, early 2018 saw the sector enter a downtrend until mid-year. It then retraced briefly before continuing its downward trajectory through the end of the year.
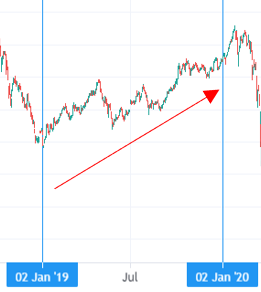
Early 2019 began with an uptrend similar to 2017, continuing through to the end of the year.
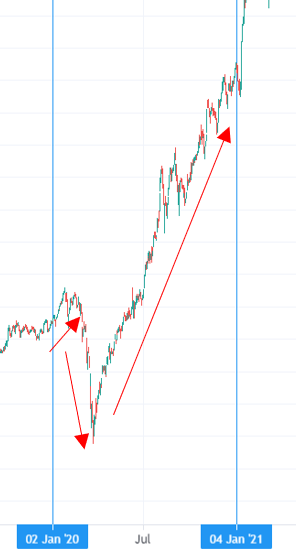
In 2020, the sector started with an uptrend, but in early March it experienced a severe downtrend.
Impact of Covid-19 on Bursa Malaysia Sectors
As we all know, Covid-19 struck Malaysia in early March 2020, leading to the first-ever Movement Control Order (MCO). During this period, nearly all sectors experienced a sharp decline.
However, the technology sector made a remarkable comeback, rocketing upward to create new resistance levels at the highest point compared to all previous years.
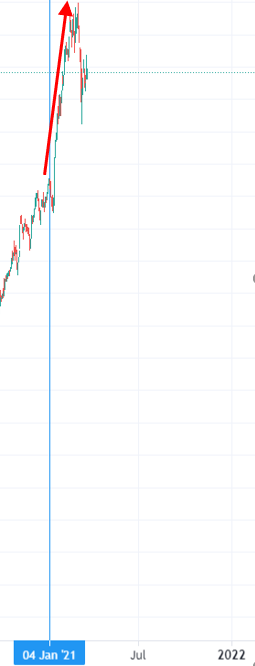
As of March 2021, the sector remained in an uptrend carried over from the previous year, with some minor price dips but still trading above the 2020 resistance level. One contributing factor was the global semiconductor chip shortage.
Conclusion
The trend of the technology sector through the end of 2021 was one to watch closely. Based on analysis of previous years, investors can form expectations about future sector trends.
However, forecasting is not based solely on charts — you must also consider current issues and factors that influence stock prices within each sector.
As always, any investment decision should be made with proper knowledge. We all want to profit from our stock trades, and that begins with education before applying the techniques we have learnt.
For any questions about stocks, reach out to the Mahersaham team at app.mahersaham.com/chat. Our team will be happy to assist you.
We also provide basic stock learning videos if you are interested in learning about stocks.
FAQ - Stock Sector Analysis
1. Why is it important to analyse stocks by sector?
Analysing stocks by sector helps investors identify which sectors are growing or declining. This makes it easier to select high-potential counters and reduces the risk of investing in underperforming sectors.
2. What are the main sectors on Bursa Malaysia?
Bursa Malaysia has various sectors including Technology, Plantation, Finance, Property, Construction, Health Care, Consumer, and Energy. Each sector has different characteristics and business cycles.
3. How can you identify a trending sector?
Investors can monitor sectoral indices on Bursa Malaysia, follow current economic news, and use platforms like TradingView to view overall sector performance and identify current trends.
4. Does supply and demand affect stock sector movements?
Yes, the concept of supply and demand significantly influences sector movements. When demand for a sector''s products or services increases, stock prices within that sector tend to rise, and vice versa.
Final Thoughts
Analysing stocks by sector is an essential skill for every investor. It helps you make more informed decisions and reduces investment risk.
Start your investment journey today. Open a CDS account with Mahersaham and download our free stock ebook for a complete guide to stock investing.