VWAP Indicator: How to Use It on TradingView [Guide]
![VWAP Indicator: How to Use It on TradingView [Guide]](https://cdn.mahersaham.com/wp-uploads/2021/02/INDICATOR-VWAP-CARA-PENGGUNAAN-DI-TRADINGVIEW.png)
Hi and Assalamualaikum. Previously, I shared an article about how to use the stock screener on TradingView, so this time I will be sharing an article about the VWAP indicator.
Let us get your pen and notebook ready to jot down the important points.
What Is VWAP and Its Function?
What exactly is VWAP?
Its full name is Volume Weighted Average Price (VWAP).
It is used as a benchmark that tells you the average price of a stock taking into account all transactions within the day.
This average price can be used as an overview of the overall price and trend of a stock.
VWAP is one of the tools we can use for short-term intraday trading.
The VWAP indicator can also serve as a support level.
VWAP Calculation
The VWAP calculation is as follows: Add the total price of the day multiplied by the volume of the day and divide by the volume = the price at which the most shares were bought.
VWAP Formula: VWAP = (PRICE X VOLUME) / VOLUME
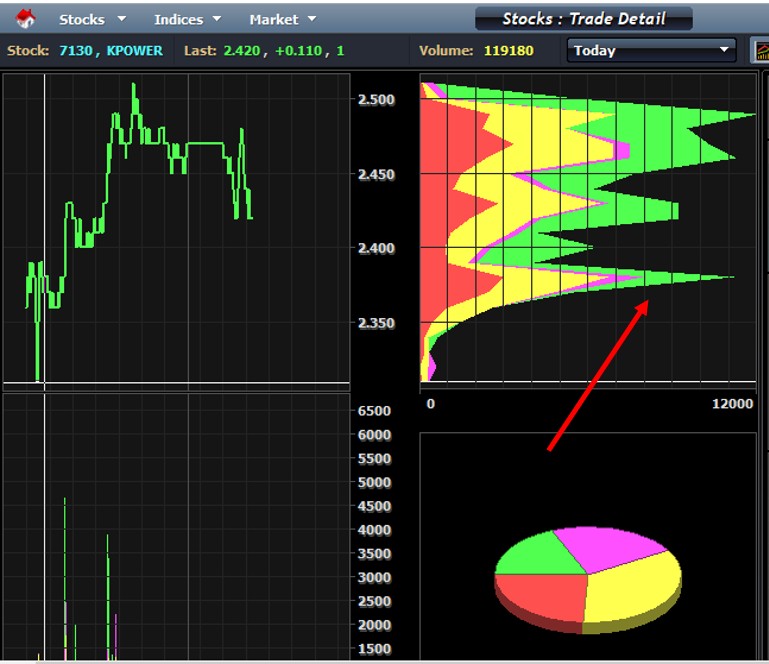
As an example, you can see VWAP on the MPLUS platform. Simply choose whichever stock counter you want to analyse.
Based on the arrow I have pointed out above, that is the VWAP.
This is the VWAP and the peak price of the stock for that day.
What You Need to Know
Among the things you need to know for intraday trading is that if the price is above the VWAP, it means it is bullish.
On the other hand, if the price is below the VWAP, it means it is bearish.
For intraday trading, traders typically use timeframes of 5 minutes, 3 minutes or 1 minute.
How to Use VWAP
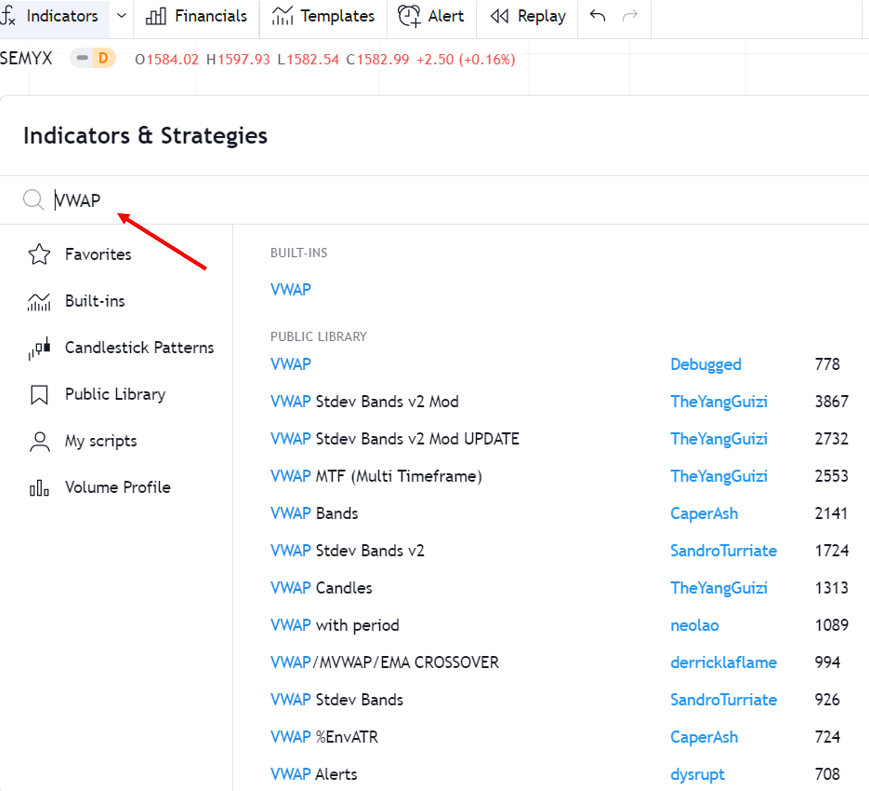
The first step is to find and select the VWAP indicator under Indicators & Strategies.
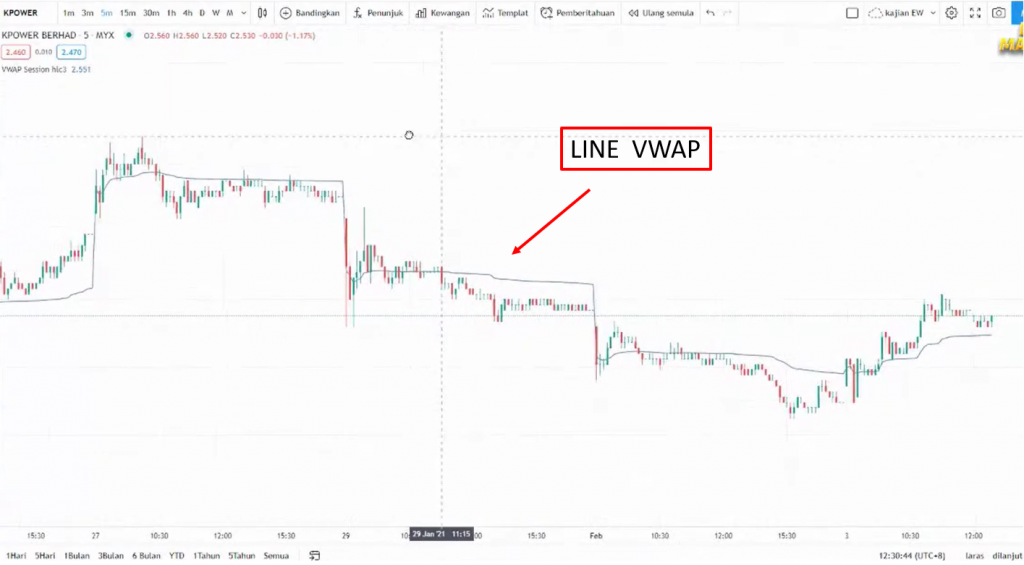
Then a line will appear as shown in the image above.
As you can see in the image, if the price is above the VWAP, it means it is a bullish signal. And we can use the VWAP line as our support level.
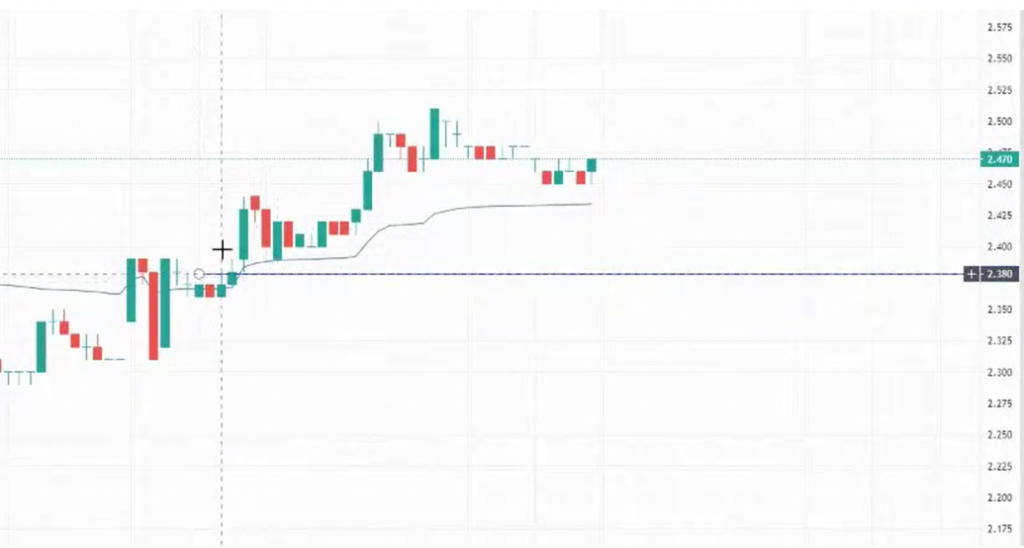
If you want to enter an intraday trade, you need to check whether the stock price has broken the support line. As long as it has not broken, you can continue to ride the uptrend.
Look for pullbacks. If it breaks out, wait for it to retrace and test the VWAP line.
Once the stock price has tested the VWAP line, you can start marking your support line.
Make sure you get a nice entry point close to the VWAP. As long as it does not break the VWAP line, just keep riding.
If the candlestick touches the VWAP line, that is a sell signal for you.
TradingView Is a Key Component of Technical Analysis
This article is one of a series written on Technical Analysis: TradingView. Technical Analysis is one of the branches related to stock research.
There are many more topics covered in the technical analysis learning series and how you can use TradingView optimally to help with your stock research.
To view other topics related to TradingView or Technical Analysis, head over to the Complete Technical Analysis Guide.
Frequently Asked Questions (FAQ)
1. What is the VWAP indicator and how does it work?
VWAP (Volume Weighted Average Price) is an indicator that calculates the average price of a stock based on trading volume. It shows the true average price paid by investors throughout the trading session.
2. How do you read signals from the VWAP indicator?
When the price is above the VWAP line, it indicates a bullish trend. When the price is below the VWAP, it indicates a bearish trend. The price touching the VWAP often becomes a pullback point or support level.
3. Is VWAP suitable for trading stocks on Bursa Malaysia?
Yes, VWAP is suitable for use with Bursa Malaysia stocks, especially counters with high trading volume. It helps identify fair pricing and suitable entry points.
4. Can VWAP be used together with other indicators?
Yes, VWAP is often combined with indicators such as Bollinger Bands, Moving Average or RSI for signal confirmation. This combination provides a more comprehensive analysis for trading decisions.
Ready to start investing in stocks? Open a CDS account with Mahersaham today. Download our free stock basics ebook for a complete beginner''s guide!