Best Trading Indicators: Which One Is Right for Beginners?

"Which indicator should I use?"
This is one of the most popular questions asked by beginner traders in Malaysia. And it is perfectly valid — when you open TradingView or any trading platform, there are over 100 types of technical indicators to choose from. From RSI, MACD, Moving Average, all the way to Bollinger Bands and Ichimoku Cloud.
The result? Many traders end up placing 5-6 indicators at once on a single chart, and end up more confused than before.
In this article, we will answer this question based on actual backtest data — not mere opinions. We reference studies that analysed nearly 100 years of stock market data to determine which indicators truly work.
Quick Answer
RSI (Relative Strength Index) is the most reliable indicator with a win rate of 79.4% based on a 100-year study of Dow Jones data by NewTrading.io. However, the best indicator actually depends on your trading style — and combining 2-3 indicators from different categories is more effective than relying on a single indicator alone.
What Is a Technical Indicator?
A technical indicator is a mathematical tool that calculates price and volume data to help traders make decisions. It is not a crystal ball that can predict the future with precision — but it helps you read the "language" of price movements.
Think of an indicator like a compass when hiking a mountain. A compass cannot tell you whether it will rain or not, but it helps you know the right direction.
Each indicator has a different purpose:
- Some show the trend direction (going up or down?)
- Some measure momentum (strong or weak?)
- Some measure volatility (calm or turbulent?)
That is why it is important for you to understand indicator categories before choosing which one to use.
3 Indicator Categories You Must Know
Before we go to the ranking, you need to understand that all technical indicators can be categorised into 3 main groups:
1. Trend Indicators
Purpose: Identify market direction — uptrend, downtrend, or sideways.
Examples: Moving Average (SMA/EMA), Ichimoku Cloud, Parabolic SAR
When to use: To confirm whether the market is trending or not before entering a position.
2. Momentum Indicators (Oscillators)
Purpose: Measure the speed and strength of price movements. Helps identify when prices are overbought (too expensive) or oversold (too cheap).
Examples: RSI, MACD, Stochastic Oscillator
When to use: To find precise entry points and identify potential reversals.
3. Volatility Indicators
Purpose: Measure the degree of price fluctuation. Is the market calm or turbulent?
Examples: Bollinger Bands, Average True Range (ATR)
When to use: To set appropriate stop losses and identify breakouts.
Important Rule: Do not use more than one indicator from the same category. This is called indicator redundancy — you only get the same information repeated without any additional benefit.
Top 5 Best Trading Indicators (Based on Backtest Data)
This ranking is based on a comprehensive study by NewTrading.io that analysed nearly 100 years of DJIA (Dow Jones Industrial Average) data using backtesting. The study was divided into two phases: In-Sample Period (1928-1995) to develop strategies, and Out-of-Sample Period (1996-2024) to validate their effectiveness.
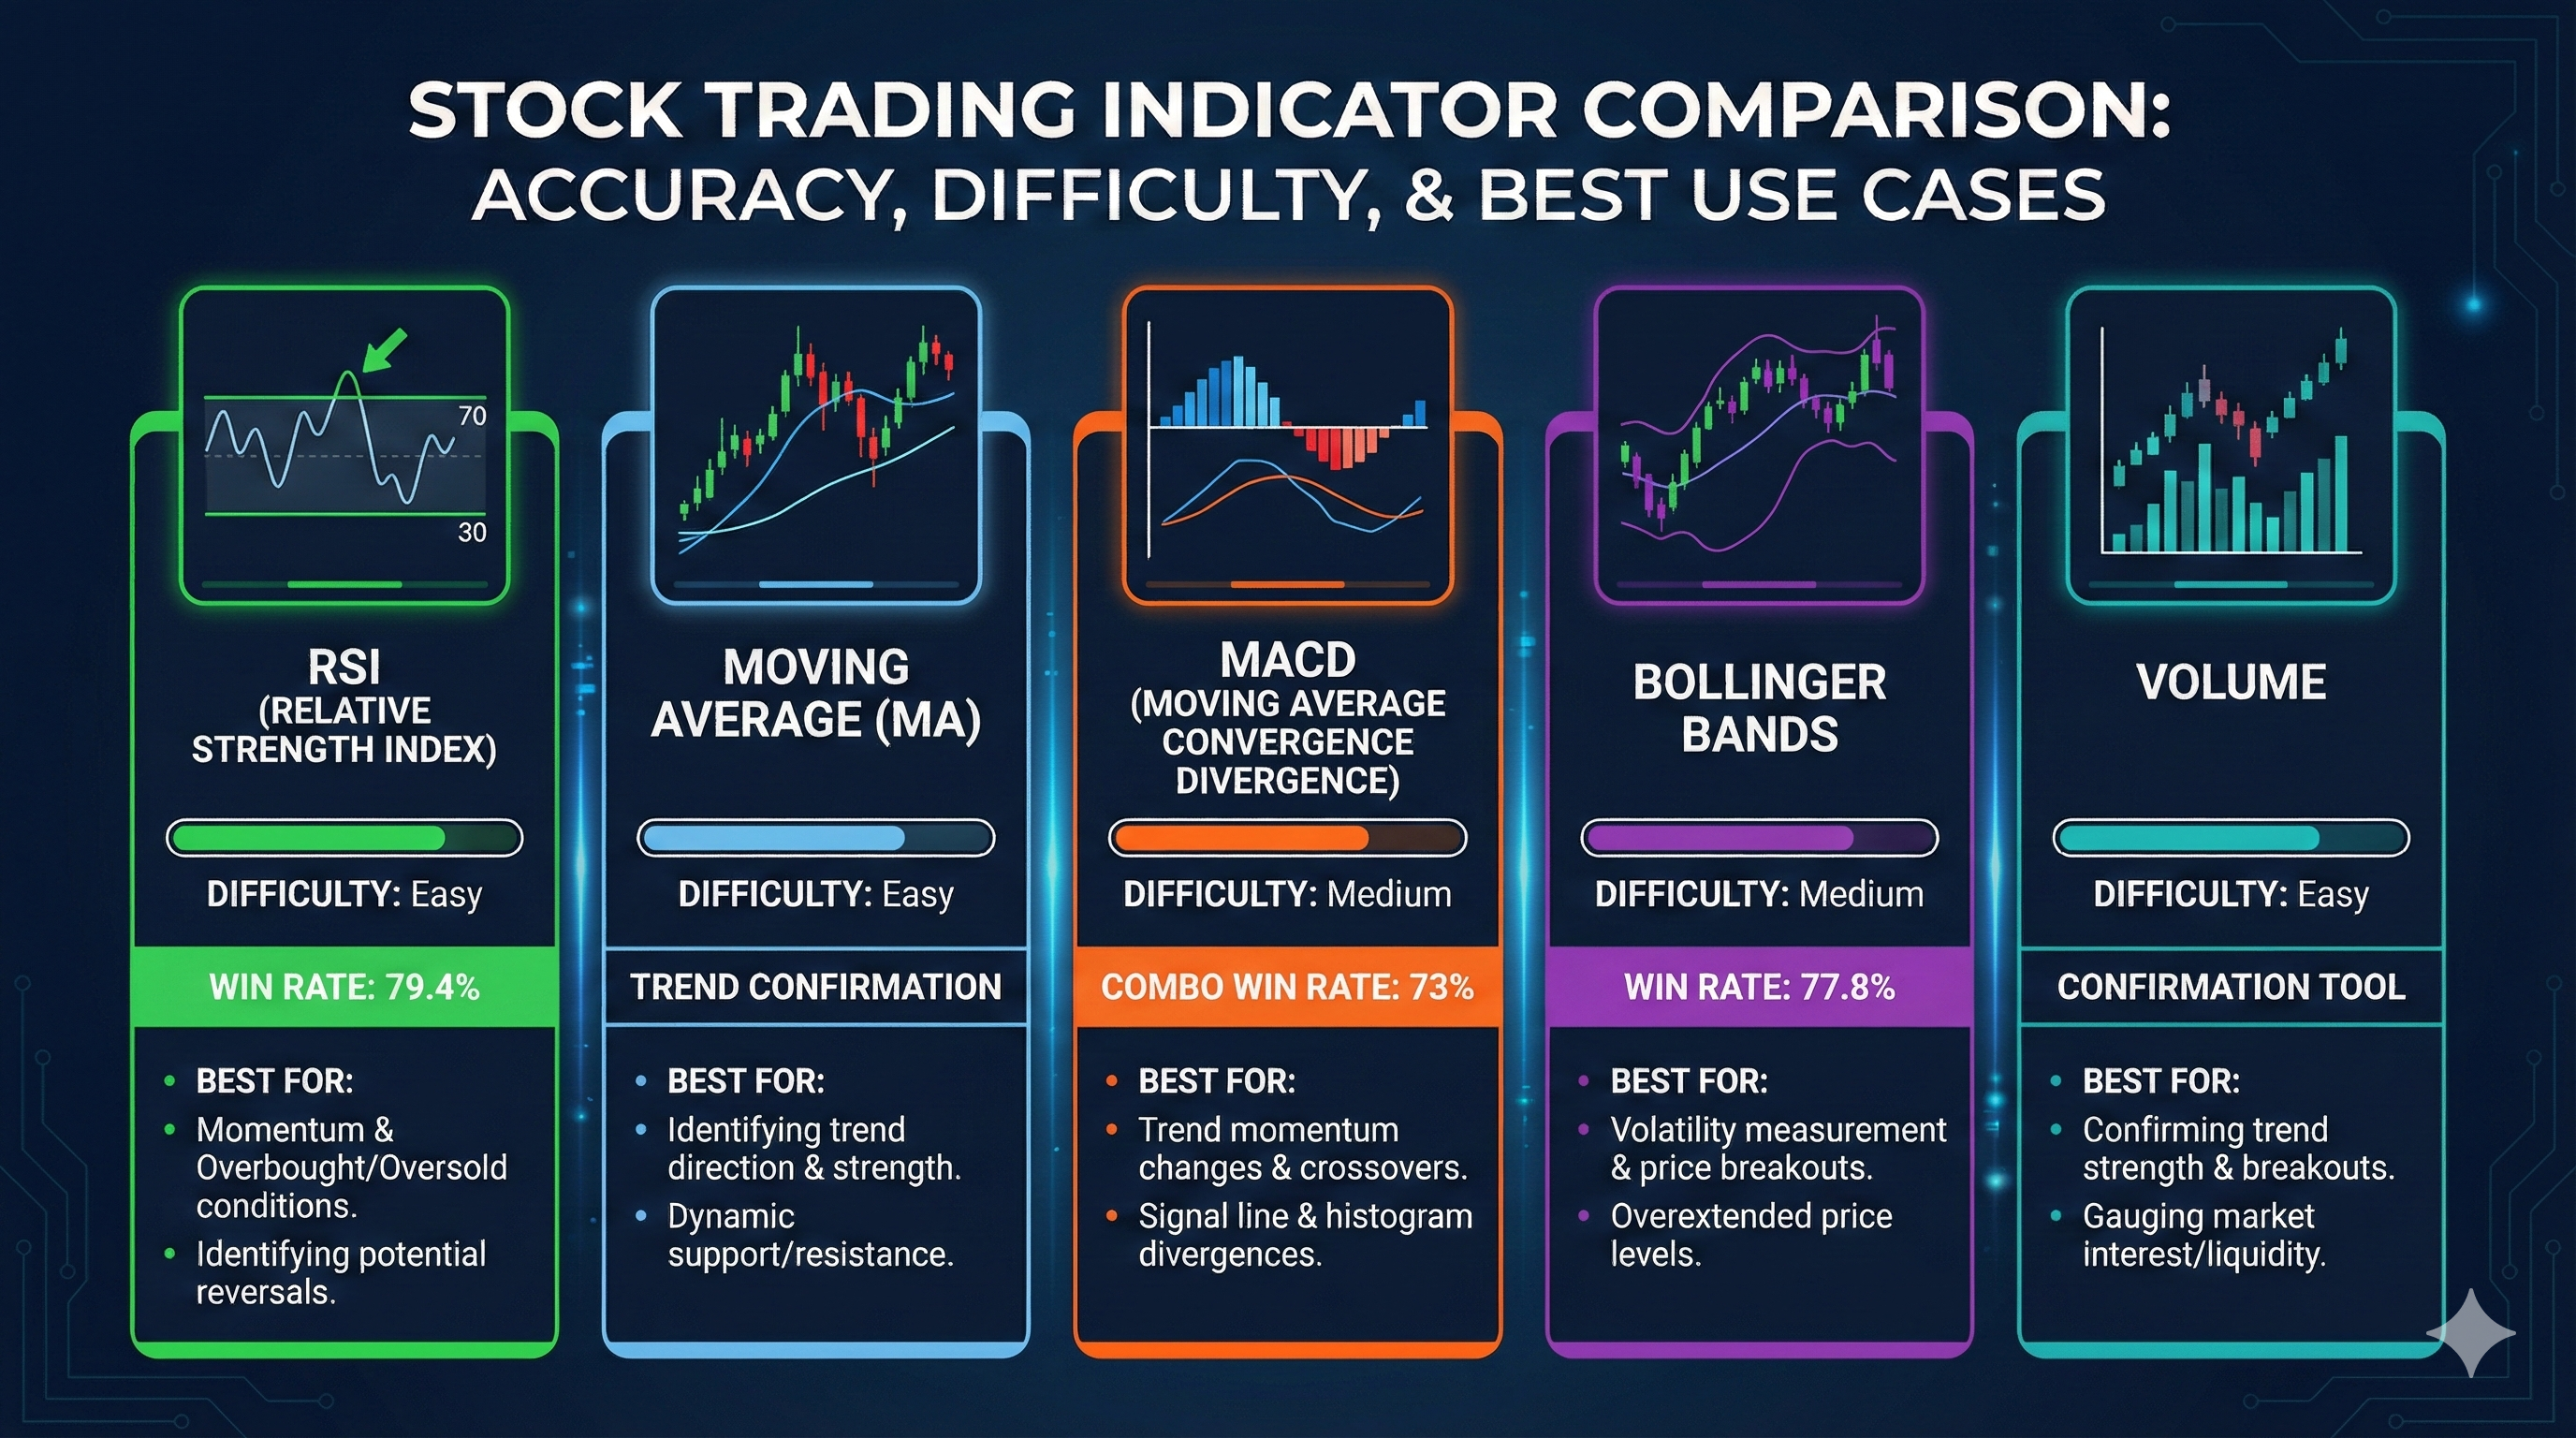
#1: RSI (Relative Strength Index) — Win Rate 79.4%
Category: Momentum
Difficulty: Easy (suitable for beginners)
RSI is the most reliable indicator based on this study, with an average win rate of 79.4% across both test periods. A separate study by LiberatedStockTrader.com which tested RSI on over 23,000 trades also confirmed its effectiveness.
What RSI shows:
- Value between 0 and 100
- Above 70 = Overbought (price may be too high, potential decline)
- Below 30 = Oversold (price may be too low, potential rise)
How to use RSI for beginners:
- Open a stock chart on TradingView
- Add the RSI indicator (default setting: 14 period)
- Watch when RSI drops below 30 — this is a potential buy signal
- Watch when RSI rises above 70 — this is a potential sell signal
Pro Tip: A study by QuantifiedStrategies.com found that RSI with a 2-day setting on SPY achieved a win rate of up to 91%. However, this shorter setting is more suitable for experienced traders.
For a more detailed guide on RSI and Stochastic, read our article: Stochastic Oscillator & RSI Indicator on TradingView.
#2: Moving Average (EMA/SMA) — Return Rate 1.60
Category: Trend
Difficulty: Very Easy (most suitable for beginners)
Moving Average is the easiest indicator to understand and one of the most effective. EMA (50) recorded a return rate of 1.60 in the same study — meaning every RM1 of risk has the potential to return RM1.60.
What MA shows:
- Average price over a specific period (e.g., 20 days, 50 days, 200 days)
- Price above MA = uptrend
- Price below MA = downtrend
Two main types:
- SMA (Simple Moving Average): Regular average, more stable
- EMA (Exponential Moving Average): Gives more weight to recent prices, more responsive
Popular strategy — Golden Cross & Death Cross:
- Golden Cross: EMA 50 crosses above EMA 200 from below → Strong buy signal
- Death Cross: EMA 50 crosses below EMA 200 from above → Strong sell signal
Moving Average is the foundation for many other indicators including MACD and Bollinger Bands. If you only want to learn one indicator, start with this one.
#3: MACD (Moving Average Convergence Divergence) — Win Rate Combo 73%
Category: Momentum + Trend
Difficulty: Moderate
MACD is a unique indicator because it combines trend and momentum elements. When combined with RSI, this combo achieves a win rate of 73% according to QuantifiedStrategies.com.
What MACD shows:
- MACD Line = EMA 12 - EMA 26
- Signal Line = EMA 9 of the MACD Line
- Histogram = Difference between MACD Line and Signal Line
Key signals:
- MACD Line crosses above Signal Line → Buy signal
- MACD Line crosses below Signal Line → Sell signal
- Histogram getting larger → Momentum getting stronger
MACD is most effective in a trending market — when the market is clearly going up or clearly going down. In a sideways market, MACD can give false signals.
Want to learn more? Read our guides: MACD Indicator - How to Use It in Stock Analysis and How to Use MACD on TradingView.
#4: Bollinger Bands — Win Rate 77.8%
Category: Volatility
Difficulty: Moderate
Bollinger Bands recorded a win rate of 77.8% — the second highest after RSI. This indicator was created by John Bollinger in the 1980s and remains relevant to this day.
What Bollinger Bands show:
- Upper Band = SMA 20 + (2 x standard deviation)
- Middle Band = SMA 20
- Lower Band = SMA 20 - (2 x standard deviation)
How to read:
- Price touches Upper Band → Potentially overbought
- Price touches Lower Band → Potentially oversold
- Bands narrowing (squeeze) → Low volatility, breakout is imminent
- Bands widening → High volatility
Bollinger Squeeze is one of the strongest signals — when bands narrow for a long time, it is like a compressed spring. When it breaks, the price movement is usually strong and sudden.
For the full tutorial: Bollinger Bands Indicator & How to Use It on TradingView.
#5: Volume (OBV — On-Balance Volume)
Category: Confirmation
Difficulty: Easy
Volume is not a traditional technical indicator, but it is the most important for confirmation. Without volume, all signals from other indicators may be meaningless.
Basic principles:
- Price rising + high volume = Strong and valid rise
- Price rising + low volume = Weak rise, may not sustain
- Price falling + high volume = Strong selling, likely downtrend
- Price falling + low volume = Weak selling, may rebound
OBV (On-Balance Volume) calculates volume cumulatively — adding volume on up days and subtracting on down days. When OBV rises while prices remain flat, this is a sign that smart money is accumulating shares (accumulation).
On Bursa Malaysia, pay particular attention to unusual volume — when volume is significantly higher than average. This often signals major interest from institutions or market "sharks".
Comparison Table: 5 Best Indicators
| Indicator | Category | Win Rate | Difficulty | Best For |
|---|---|---|---|---|
| RSI | Momentum | 79.4% | Easy | Entry/exit timing |
| Moving Average | Trend | — | Very Easy | Identifying trend direction |
| MACD | Momentum + Trend | 73%* | Moderate | Confirming trend + momentum |
| Bollinger Bands | Volatility | 77.8% | Moderate | Identifying breakouts |
| Volume | Confirmation | — | Easy | Confirming signal strength |
*MACD win rate is based on a combo with RSI
Best Indicator Combos for Beginners
The real secret is not finding one "best" indicator — but combining 2-3 indicators from different categories to get a more complete picture, as recommended by Tradeciety.com.
Beginner Combo (Recommended): RSI + EMA + Volume
This is the combination we recommend for new traders:
- EMA 20 & EMA 50 → Determine trend direction (Trend)
- RSI (14) → Find precise entry points (Momentum)
- Volume → Confirm signal strength (Confirmation)
Example setup:
- EMA 20 crosses above EMA 50 (uptrend)
- RSI below 30 and starting to rise (oversold, momentum shifting)
- Volume increasing (strength confirmed)
- Signal: BUY
Intermediate Combo: MACD + Stochastic + Bollinger Bands
For traders who are already comfortable with the basics:
- Bollinger Bands → Identify volatility and range
- MACD → Confirm momentum direction
- Stochastic → More precise entry timing
Common Mistake: Too Many Indicators
This is the #1 mistake made by beginner traders — placing 5-6 indicators on a single chart until the chart looks like a rainbow.
Why is this a problem?
- Indicator redundancy — If you use RSI, Stochastic, and CCI simultaneously, all three are momentum oscillators. You get the same information three times without any added value.
- Paralysis by analysis — The more indicators you have, the more conflicting signals you get. RSI says buy, MACD says sell, Bollinger Bands says wait — and you end up doing nothing.
- False confidence — When 3 indicators from the same category all say "buy", you feel very confident. But in reality, you are only seeing one type of information three times.
The Golden Rule
Maximum 2-3 indicators only. Choose one from each category:
- 1 Trend indicator (e.g., EMA)
- 1 Momentum indicator (e.g., RSI)
- Volume as confirmation
This is more than enough to make good trading decisions.
To learn how to set up indicators in TradingView, refer to our guide: TradingView: How to Add & Remove Indicators.
How to Choose the Right Indicator for You
The best indicator depends on your trading style:
Swing Trader (Hold for several days to weeks)
- Best: RSI + EMA 20/50 + Volume
- Focus on the daily chart
- Look for oversold conditions in an uptrend
Day Trader (Buy and sell within a single day)
- Best: MACD + Bollinger Bands + VWAP
- Focus on 5-minute or 15-minute charts
- Look for breakouts and momentum
Position Trader (Hold for weeks to months)
- Best: EMA 50/200 + RSI Weekly + Volume
- Focus on the weekly chart
- Look for Golden Crosses and long-term trends
Bursa Malaysia Traders — Additional Tips
- Low liquidity on penny stocks — indicators may be less accurate
- Volume is extremely important on Bursa Malaysia because "shark" movements are often preceded by unusual volume
- Use the daily chart as the primary timeframe for most Bursa Malaysia stocks
First Steps for Beginners
If you are just starting out and unsure where to begin, follow these steps:
Week 1-2: Learn to Read Charts
- Open a TradingView account (free)
- Learn to read basic candlestick patterns
- Understand the concept of support and resistance
Week 3-4: Add Your First Indicator
- Add EMA 20 and EMA 50 to your chart
- Observe how prices interact with the MA
- Learn to recognise the Golden Cross and Death Cross
Week 5-6: Add RSI
- Add RSI (14) to your chart
- Observe overbought signals (>70) and oversold signals (<30)
- Try combining RSI with MA — look for oversold conditions in an uptrend
Week 7-8: Observe Volume
- Add the Volume indicator to your chart
- Watch for unusual volume — why did volume suddenly spike?
- Confirm RSI and MA signals with volume
After 2 months of practice, you will have a basic trading system that works. From there, you can explore additional indicators such as MACD, Bollinger Bands, or Ichimoku Cloud.
FAQ: Frequently Asked Questions About Trading Indicators
1. Can I use just one indicator?
You can, but it is less effective. A single indicator only provides one perspective. Combining 2-3 indicators from different categories gives a more complete picture and reduces false signals.
2. Which indicator is best for Bursa Malaysia stocks?
RSI + EMA + Volume is the most versatile combo for Bursa Malaysia stocks. Most stocks on Bursa respond well to RSI overbought/oversold signals, especially blue chip and mid-cap stocks.
3. Are indicators free or do I need to pay?
All indicators mentioned in this article are free on TradingView and most trading platforms. You do not need to buy expensive indicators — the standard indicators that are already available are more than sufficient.
4. Why do indicators sometimes give wrong signals?
Indicators are based on past data (lagging). They calculate price data that has already occurred, not predict the future. That is why indicators are sometimes late or give false signals, especially in a sideways market. Risk management remains essential.
5. What is the best indicator for gold trading?
For gold trading, Bollinger Bands + RSI is a popular combo because gold often moves within a range. According to Google Trends Malaysia, "best indicator for gold trading" is among the popular searches related to indicators.
6. How long does it take to master indicators?
Realistically, you will need 2-3 months of consistent practice to be comfortable with 2-3 basic indicators. Do not rush — focus on mastering one indicator first before adding another.
7. What is the best indicator for scalping?
For scalping (very short trades), MACD + Bollinger Bands + VWAP on a 1-5 minute timeframe. However, scalping requires extensive experience and is not recommended for beginners.
8. What is the difference between leading and lagging indicators?
Leading indicators attempt to predict future movements (e.g., Stochastic, Williams %R). Lagging indicators confirm movements that have already occurred (e.g., MA, MACD). Most popular indicators are lagging — and that is perfectly fine. Confirmation is safer than prediction.
Conclusion
Back to the original question: "Which indicator should I use?"
Based on 100 years of backtest data:
- RSI is the most reliable indicator (79.4% win rate)
- Bollinger Bands is the second best (77.8% win rate)
- EMA is the easiest and most suitable for beginners
But remember — no single indicator is perfect. The real secret is:
- Choose 2-3 indicators from different categories
- Do not overcomplicate — less is more
- Always use risk management — indicators are not a guarantee of profit
- Practise first before using real money
If you are just starting out in the world of stocks and do not yet have a foundation, we recommend downloading our free Stock Basics Ebook at /ebookasas to understand the fundamentals before using technical indicators.
And if you do not yet have a trading account, you can open a CDS Account through this link to start investing on Bursa Malaysia.