Cash Conversion Cycle & Working Capital: How to Spot a Company Heading for a Cash Crunch
Picture a company that reports rising net profit every quarter, surging sales, and a confident management team. Then, within a year, that same company is forced into a rushed rights issue or heavy borrowing just to cover salaries and suppliers. What happened?
The answer usually isn't in the income statement - it's hidden in something quieter: working capital and the cash conversion cycle (CCC). These two metrics can warn you that a company is heading for a cash crunch, even when it looks profitable on paper. This article shows you how to read those warning signs so you don't get caught holding shares of a company that is quietly running out of cash.
What Is Working Capital?
Working capital is the money actually available for a company to run its day-to-day operations. The formula is simple:
Working Capital = Current Assets - Current Liabilities
Current assets include cash, inventory, and accounts receivable (money customers still owe). Current liabilities include accounts payable (money owed to suppliers), short-term loans, and bills due within 12 months.
If working capital is positive, the company has enough short-term assets to cover short-term obligations. If it's negative, that's a warning - except for certain business models (like large retailers) that operate with negative working capital in a perfectly healthy way. To understand more about measuring a company's ability to pay short-term debts, see our article on the liquidity ratio.
But working capital alone doesn't tell the whole story. Two companies can have identical working capital, yet one is healthy and the other is drowning. The difference? How long that money stays tied up before it comes back as cash. That's where the CCC comes in.
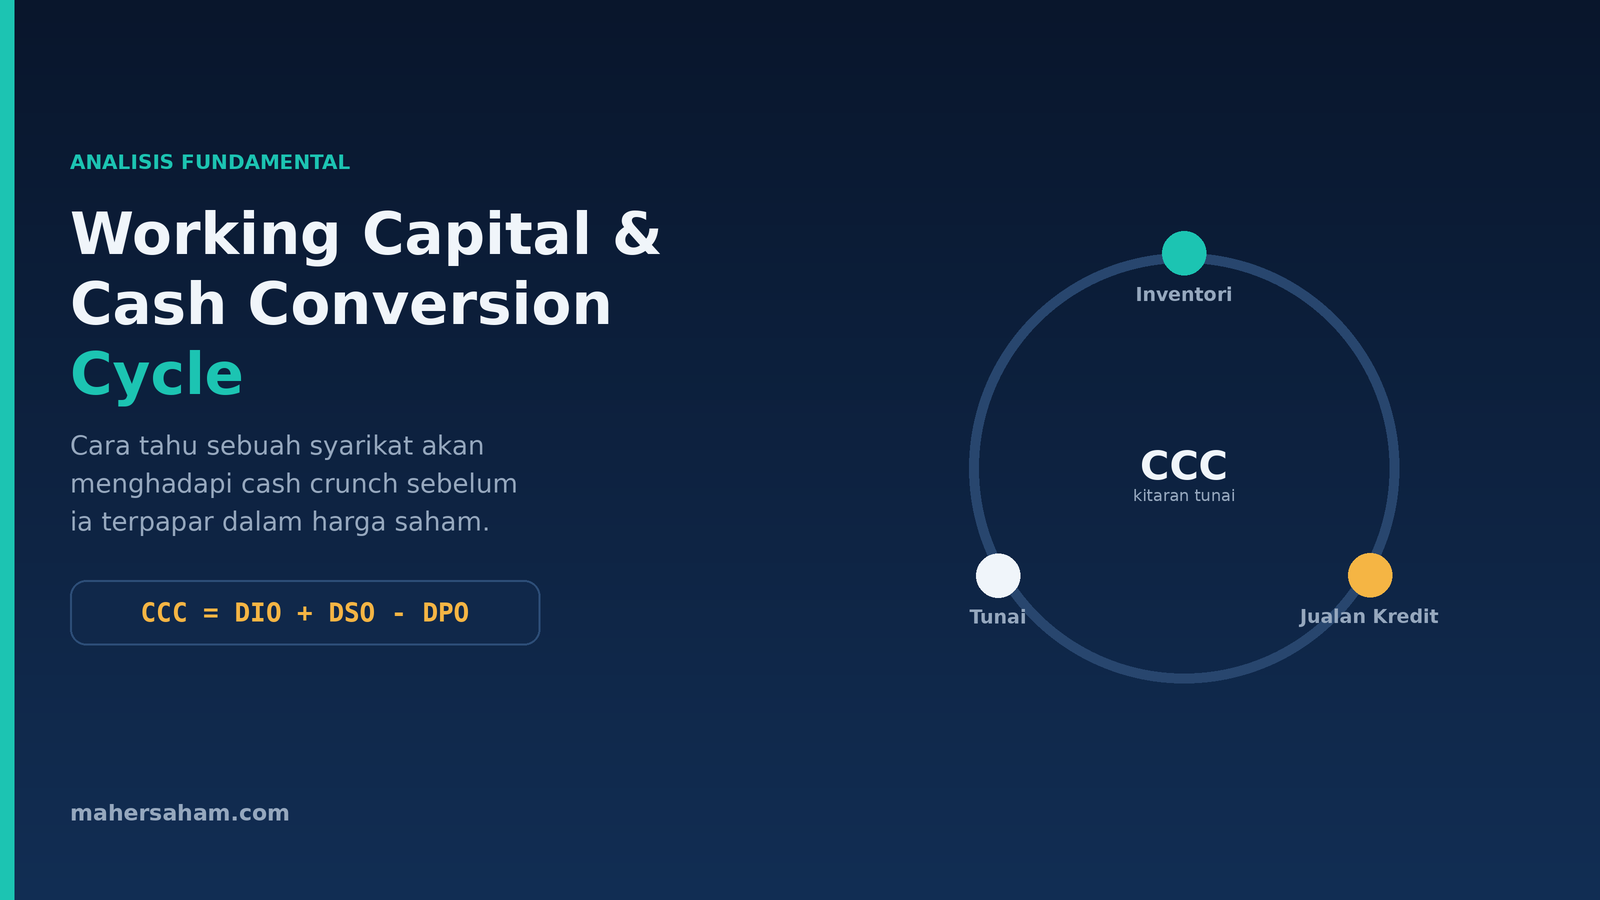
What Is the Cash Conversion Cycle (CCC)?
The cash conversion cycle measures how many days a company's money stays "stuck" in the business process before it returns as cash in hand. According to the Corporate Finance Institute, the CCC measures how efficiently a company converts inventory and other resources into cash flow.
Think of it this way. A factory buys raw materials today (cash out). It holds them as stock, processes them into products, and sells them. But customers only pay 30-60 days later. Throughout that period, the company's money is "buried" in stock and unpaid invoices. The CCC counts how many days this entire cycle takes.
The shorter the CCC, the faster cash recycles - and the less the company depends on external borrowing to fund operations. The longer the CCC, the more money is locked up, and the higher the risk of a cash crunch if sales suddenly slow.
The 3 Components of CCC: DIO, DSO, and DPO
The CCC formula combines three components:
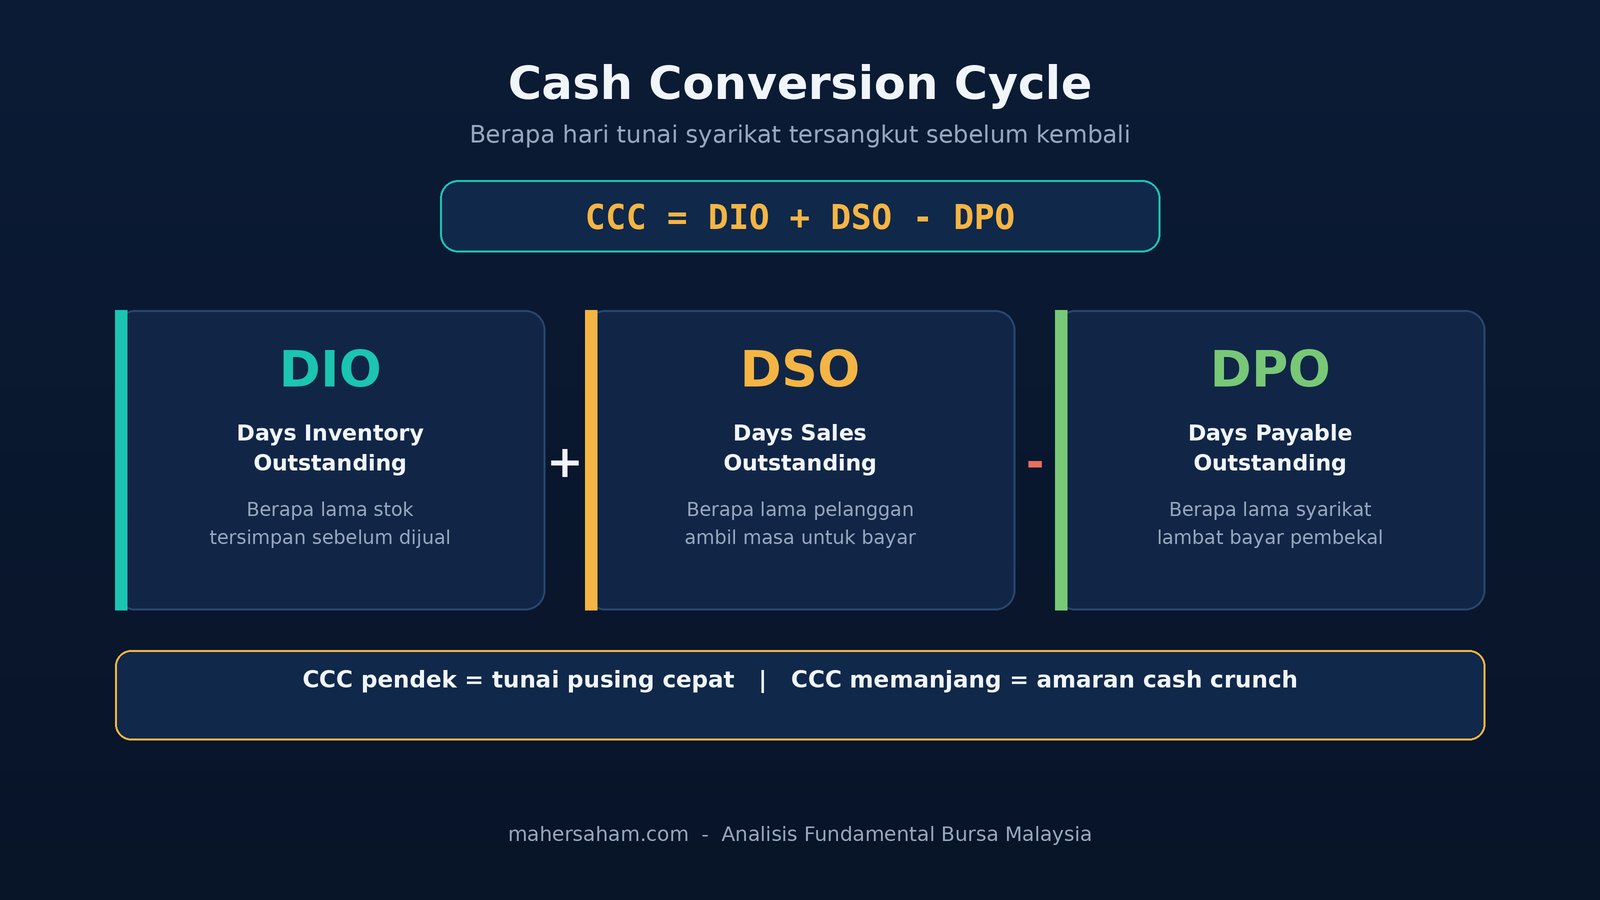
CCC = DIO + DSO - DPO
Let's break them down one by one, because this is the key to understanding the whole concept:
DIO - Days Inventory Outstanding
The average number of days stock sits before it's sold. A high DIO means inventory is piling up - possibly a sign of slow sales or unsellable products.
DIO = (Average Inventory ÷ Cost of Goods Sold) × 365
DSO - Days Sales Outstanding
The average number of days it takes to collect payment after a sale. A high DSO means customers are slow to pay - the company's money is stuck in receivables.
DSO = (Average Accounts Receivable ÷ Revenue) × 365
DPO - Days Payable Outstanding
The average number of days a company takes to pay its suppliers. A high DPO is actually good for cash flow - the company holds onto its money longer. This is the only component subtracted in the formula.
DPO = (Average Accounts Payable ÷ Cost of Goods Sold) × 365
The logic is simple: DIO and DSO are the time your money is out and stuck, while DPO is the time you hold onto money before paying suppliers. The net CCC is how many days you must fund operations with your own cash.
How to Calculate CCC: A Practical Example
Let's take a manufacturing company, call it Company ABC, with figures from its financial statements:
- Average inventory: RM10 million
- Cost of goods sold (COGS) per year: RM73 million
- Average accounts receivable: RM12 million
- Sales per year: RM109.5 million
- Average accounts payable: RM6 million
Calculate one by one:
- DIO = (RM10m ÷ RM73m) × 365 = 50 days
- DSO = (RM12m ÷ RM109.5m) × 365 = 40 days
- DPO = (RM6m ÷ RM73m) × 365 = 30 days
CCC = 50 + 40 - 30 = 60 days
This means Company ABC must fund its own operations for 60 days before cash flows back in. If this company has RM18 million in monthly sales, it needs to ensure it has enough cash or credit facilities to cover two months of operations at any time. This is exactly why fast-growing companies (sales rising rapidly) sometimes drown the fastest - they need ever more working capital to fund an ever-larger cycle.
Positive vs Negative CCC: What It Means
A positive CCC (like the 60 days above) is normal for most manufacturing and trading companies. But some companies achieve a negative CCC - and that's actually a very strong position.
A negative CCC means the company gets paid by customers before it has to pay its suppliers. Large retailers like supermarkets and e-commerce giants often achieve this: customers pay cash immediately (DSO near zero), stock turns over fast (low DIO), but they can pay suppliers 60-90 days later (high DPO). As a result, they effectively use suppliers' money to fund growth - at no interest cost. According to J.P. Morgan, optimizing the CCC is one of the most effective ways to strengthen a cash position without borrowing.
So when you evaluate a stock, don't just look at whether the CCC is positive or negative - compare it with other companies in the same industry. A 60-day CCC might be good for a heavy machinery maker but terrible for a fresh-food retailer.
CCC by Sector on Bursa Malaysia
Every sector has its own CCC profile because business models differ. Understanding this context stops you from misreading the numbers:
- Consumer retail - usually short or negative CCC. Cash sales are immediate, stock turns over quickly. A high CCC here is a serious warning.
- Manufacturing - moderate to long CCC (30-90 days) because of production processes and credit sales. A stable trend is healthy.
- Construction and property - CCC can be very long because projects take years and payments are staged. Here, working capital and cash flow are far more critical to monitor.
- Technology and services - minimal inventory, so DIO is almost nil. The focus shifts to DSO (how fast customers pay).
Academic studies on Bursa Malaysia-listed companies also find that a shorter CCC is often associated with better profitability (ROA), reinforcing the idea that efficient working capital management is a mark of a quality company. So when you compare two companies in the same sector, the one with a shorter, more stable CCC usually has the stronger cash position.
How the CCC Warns of a Cash Crunch
This is the most important part for investors. A single CCC number isn't enough - the danger is in the trend. Here are the combinations of warning signs that often appear before a company faces a cash crunch:
- Sales rise but the CCC lengthens. An efficient company should maintain or shorten its CCC as it grows. If the CCC lengthens, it's a sign the company is "buying" growth by offering loose credit terms to customers or stockpiling inventory.
- DSO increases year over year. Customers take longer to pay - possibly a sign sales are being pushed to risky customers, or that customers themselves are facing cash problems.
- DIO increases. Inventory is piling up. Products may not be selling as expected, or the company is overproducing.
- Operating cash flow (OCF) falls even as reported profit rises. This is the most critical sign. Profit on paper, but real cash isn't coming in. To understand the difference between profit and real cash, read our article on how to read the cash flow statement.
- Accounts receivable grow faster than sales. If receivables rise 40% while sales rise 15%, something is wrong with the quality of those sales.
When several of these signs appear together, the company is often forced to plug the cash gap with new borrowing, a rights issue, or asset sales. For investors, this is the early warning before the share price tumbles. It's no coincidence that SME Corp Malaysia and repeated industry studies list cash flow problems as a leading cause of business failure - it's estimated that the majority of small companies that fail do so not because they have no profit, but because they run out of cash at the wrong time.
Where to Find These Figures in the Annual Report
Every figure you need to calculate the CCC is in a Bursa Malaysia company's annual report:
- Inventory and Accounts Receivable - in the Statement of Financial Position (Balance Sheet), under Current Assets.
- Accounts Payable - in the Balance Sheet, under Current Liabilities.
- Revenue and Cost of Goods Sold (COGS) - in the Income Statement.
Use the average of the opening and closing balances for inventory, receivables, and payables for greater accuracy. If you're new to reading these documents, our guide on how to read a Bursa Malaysia annual report will help you find each figure quickly.
Calculate the CCC for the past 3-5 years and plot the trend. A consistently lengthening trend is more concerning than a single bad year. Combine this analysis with other cash flow metrics like free cash flow yield for a more complete picture of a company's true cash health.
Common Mistakes Investors Make When Reading the CCC
- Comparing across different industries. A construction company's CCC and a software company's CCC can't be compared directly. Always compare against peers in the same sector.
- Looking at a single year. The CCC is a story of trend. One quarter can be skewed by seasonal factors.
- Ignoring the business model. A negative CCC doesn't necessarily mean the company is in trouble - for a retailer, it's a sign of strength.
- Forgetting receivables quality. A low DSO is good, but if a large share of receivables is concentrated in one big customer, concentration risk still exists.
Frequently Asked Questions (FAQ)
What is the cash conversion cycle in simple terms?
It's the number of days it takes a company to turn money invested in stock and operations back into cash in hand. The formula is CCC = DIO + DSO - DPO.
What is a good CCC in days?
There's no magic number - it depends on the industry. What matters is that the CCC is shorter than the industry average and its trend isn't lengthening year over year. A negative CCC (like large retailers) is very strong.
Can a company be profitable but still run out of cash?
Yes, and it happens more often than you'd think. Profit is calculated on an accrual basis (including sales not yet paid), while actual cash depends on when money truly comes in. A long CCC can leave a company profitable but cash-starved.
What's the difference between working capital and the cash conversion cycle?
Working capital is the amount of money (current assets minus current liabilities) available at a point in time. The CCC measures how long that money stays tied up before returning as cash. Working capital is a still photo; the CCC is the moving video.
How can the CCC predict a cash crunch?
When the CCC lengthens while sales rise and operating cash flow falls, it shows money is increasingly stuck in stock and unpaid invoices. Without sufficient credit facilities, the company eventually runs out of cash for daily operations.
Is the CCC suitable for all types of companies?
The CCC is most useful for companies with inventory and credit sales (manufacturing, trading, retail). For pure service companies or banks, this metric is less relevant because they have no physical inventory.
Where can I get the data to calculate the CCC?
All the figures are in a company's annual report: inventory, receivables, and payables from the Balance Sheet; revenue and COGS from the Income Statement. These reports are available on the Bursa Malaysia website and company portals.
Conclusion
Working capital and the cash conversion cycle are two metrics retail investors often overlook, yet they are among the best indicators for detecting cash problems before they show up in the share price. A company can hide weakness in its income statement, but it's far harder to hide money stuck in stock and unpaid invoices.
Before investing in any Bursa Malaysia stock, take the time to calculate the CCC over several years and compare it with peers. A lengthening trend is an early warning you should take seriously.
If you're serious about analysing a company before investing, the first step is having an account that lets you access and trade stocks easily.
You can open a CDS account to start investing on Bursa Malaysia as well as overseas markets such as the US and Hong Kong, all through a single account.
For beginners just starting to understand the basics of stock investing, grab our free stock market basics ebook as a starting point.
Further Reading
- Cash Flow Statement: How to Detect a Company's True Performance on Bursa Malaysia
- Free Cash Flow Yield: The Real KPI Expert Investors Track Before P/E
- The Importance of the Liquidity Ratio: 10 Key Reasons & Case Studies from the Malaysian Stock Market
- EV/EBITDA: The Valuation Metric for High-Debt Companies
- How to Read a Bursa Malaysia Annual Report Without a Headache