Types of Stock Breakouts Every Trader Should Know

Did you know there are several types of breakouts in stock trading?
Previously, I shared about what a breakout is and tips for buying breakout stocks.
This time, I want to share about the different types of breakouts.

What Is a Breakout?
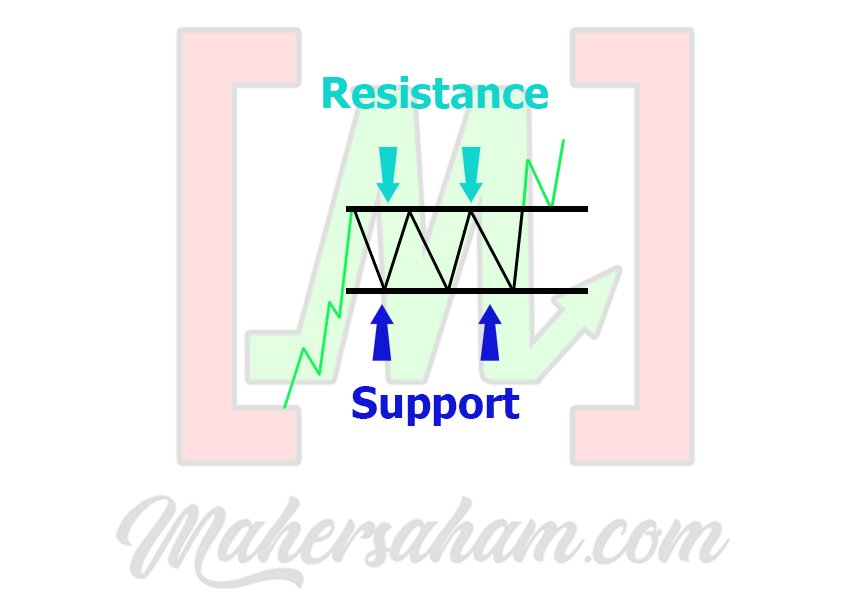
As I explained in the previous article, a breakout occurs when the price breaks through a resistance level and stays above that level.
You can refer to the illustration below.
Types of Breakouts
There are actually many types of breakouts, but this time I will share a few common types you will encounter once you enter the stock market.
1. Horizontal Resistance Breakout
- Breaking through a horizontal resistance level
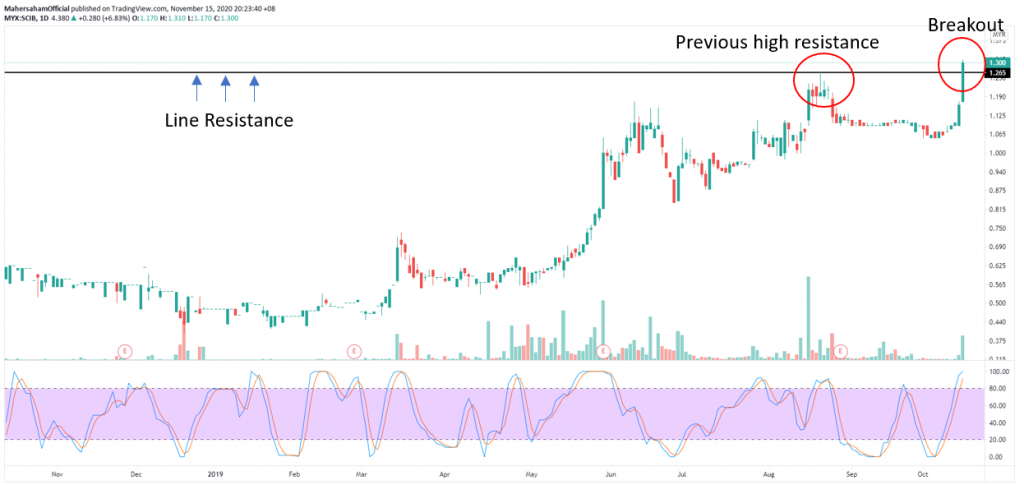
How do you identify a horizontal resistance breakout from the chart above?
First, you need to draw a horizontal resistance line. If you notice, the breakout occurred when the price broke through the previous high resistance level.
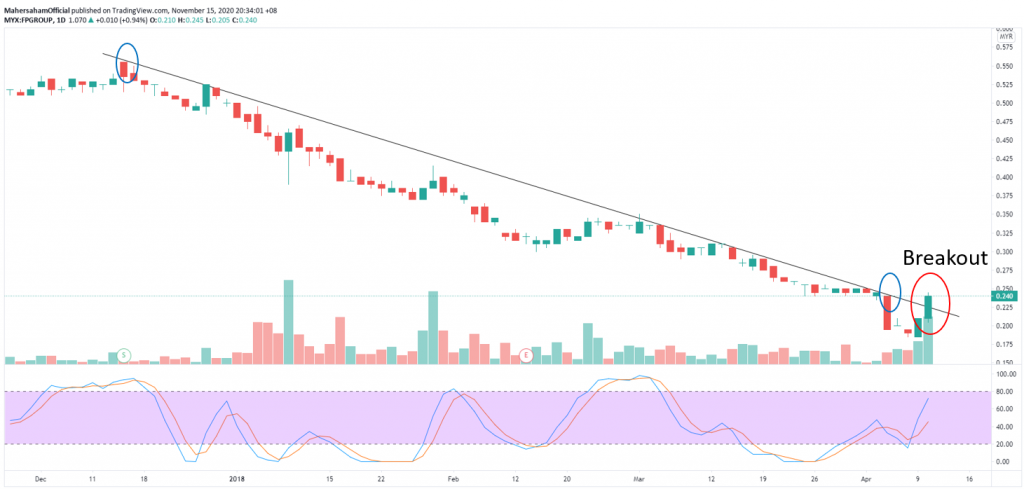
2. Trendline Breakout
- The price breaks through the trendline
Have you ever wondered how to draw a trendline?
Here is what you need to do:
If the market is in a downtrend:
- 1. Find two clear resistance points. (The more, the better)
- 2. Connect the resistance points using a trendline.
If the market is in an uptrend:
- 1. Find two clear support points. (The more, the better)
- 2. Connect the support points using a trendline.
You can read about how to draw and determine support and resistance and how to understand the concept of support and resistance easily if you are not yet familiar with support and resistance.
You can see from the chart above how I connected the points using a trendline.
The two points in the blue circles are the resistance points I connected using a trendline.
Then notice that wherever the price breaks through the trendline, that is where the breakout occurs.
You can focus on the red circle. It clearly shows a breakout known as a trendline breakout.
3. 52-Week High Breakout
A 52-week high breakout is when a stock reaches its highest price level within a one-year period.
As we know, one year equals 52 weeks.
1 year = 52 weeks
Right, let us look at the example in the chart below.
If we look at this stock, its highest price throughout 2020 was 40 sen.
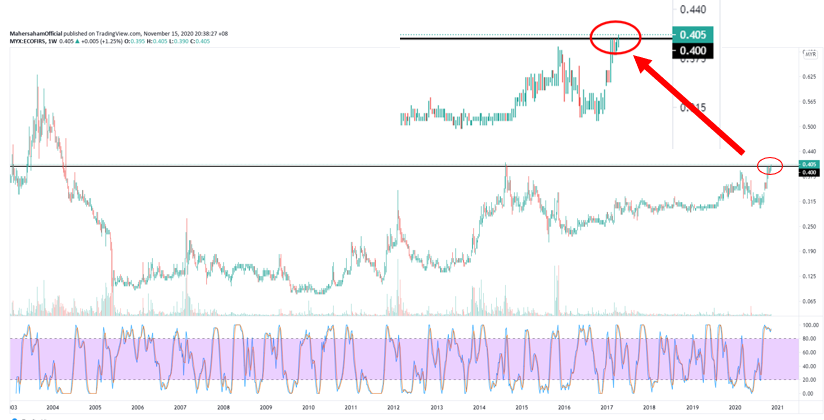
If it successfully breaks past the 52-week high, there is a possibility the stock could go much further.
4. All-Time High Breakout
A breakout of the highest price ever recorded.
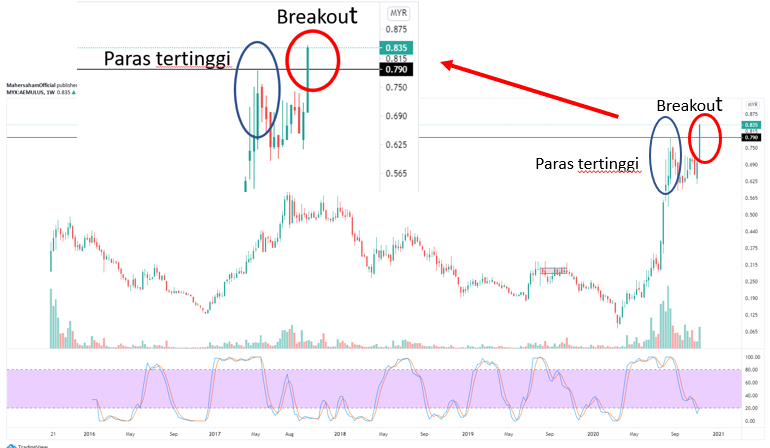
If we look at the chart above, since this stock was listed on Bursa Malaysia until today, the highest share price was 79 sen. You can refer to the blue circle.
Then look at the red circle, where the breakout occurred at that time. It surpassed the all-time highest price level.
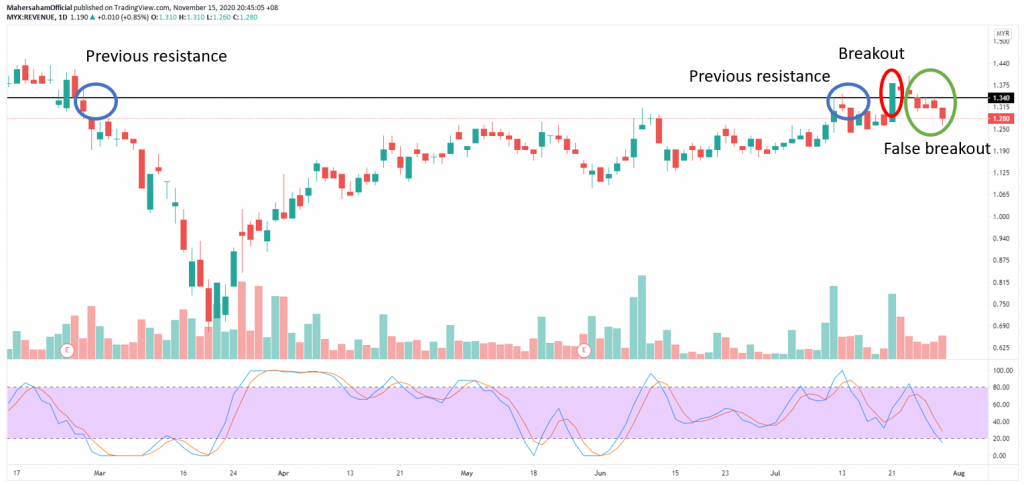
5. False Breakout
This is the type of breakout that traders want to avoid. It is a breakout that fails to materialise.
Why does it fail?
At the beginning of this article, I mentioned that:
a breakout occurs when the price breaks through a resistance level and stays above that level
Even though a breakout has occurred, if it fails to hold, the stock price does not rise — in fact, the opposite happens.
In our analysis, there will be times when our study does not work out.
That is why we need a trading plan so we know what to do when a false breakout occurs.
What should you do? You should cut loss according to your trading plan.
We can only know that a breakout is a false breakout after it has already happened.
And we cannot predict whether an ongoing breakout is a false breakout or not.
Characteristics of a Breakout
- Marubozu candle
- High volume
- Gap up
You can read about how to identify a successful breakout for a more detailed explanation of breakout characteristics.
Hope this was beneficial!
FAQ About Stock Breakouts
What is the most common type of breakout?
The horizontal resistance breakout is the most commonly observed type. It occurs when the stock price breaks through a clearly defined horizontal resistance level and stays above it.
How can I tell the difference between a real breakout and a false breakout?
Look for confirmation signals such as a marubozu candle, high trading volume, and a gap up. Unfortunately, you can only confirm a false breakout after it has already occurred, so always have a trading plan with a cut-loss strategy.
Is a 52-week high breakout a good buy signal?
A 52-week high breakout can indicate strong upward momentum, suggesting the stock could go higher. However, always combine it with other technical analysis tools and proper risk management before making a trade.
Improve Your Investing Knowledge
Successful investing starts with a solid foundation of knowledge.
Investment Basics:
Download our free ebook for a complete guide.
Open a CDS Account:
Ready to start? Open a CDS account now.