Understanding Market Depth: A Simple Guide to Bid & Ask
What is Market Depth?
Market Depth is the display of buy and sell orders placed by traders and investors in the stock market.
For example, if you want to buy a particular stock counter, you need to submit an order through your Trading Platform.
That order will then appear in the Market Depth.
Simply put, it is like queuing up in the Market Depth until your submitted order gets matched.
Matched here means the buy price you keyed in has been successfully paired with a seller who is queuing to sell at your buy price.
Once matched, you will own the stock counter you wanted to buy. The same applies if you want to sell a stock counter.
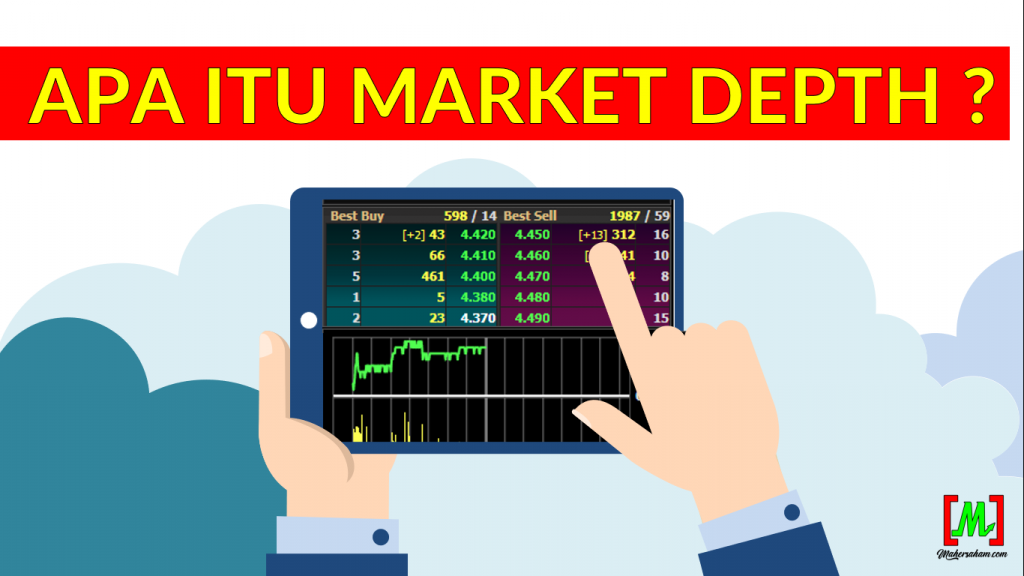
Market Depth Best Buy (Bid)
Best Buy is the section showing buy (bid) orders from traders and investors. All buy orders placed by buyers will appear in this section.
Naturally, when buying, you would want to buy at the cheapest price possible, right? And sell at the highest price possible to maximise your profit.
So in the Market Depth Best Buy section, the higher the stock price you are willing to buy at, the faster the potential for your order to get matched (to own the stock).
For example, if you look at the market depth diagram below, the topmost layer is the highest price a buyer is willing to queue at, and the layers going downward show increasingly lower prices.

If you queue at the lowest layer, you will need to wait for the price to match all the way down to your turn.
If you want to get matched immediately (own the stock straight away), you need to queue at the highest price, which is at the topmost layer.
Market Depth Best Sell (Ask)
Best Sell is the section showing sell (ask) orders from traders and investors. All sell orders placed by sellers queuing to sell will appear in this section.
Naturally, when selling, you would want to sell at the highest price possible to get the best returns.
But remember, as long as there is no buyer queuing to buy at your selling price, your sell order will not get matched.
So you will need to wait until there is a buyer willing to queue and buy at the price you want to sell at.
For example, if you look at the Market Depth Best Sell diagram, the topmost layer is the cheapest price and the layers going downward show increasingly higher prices.
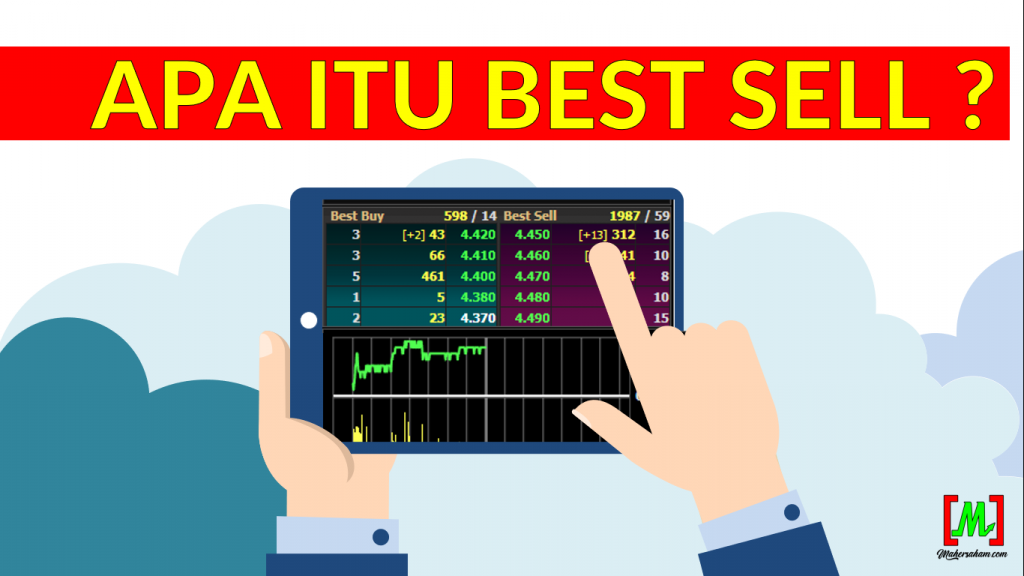
This means, if you are willing to sell at a lower price, the faster the potential for your order to get matched (the stock is sold from your portfolio).
Meanwhile, the higher your selling queue price, you will need to wait until there is a buyer willing to buy at that price.
Concept of Best Buy & Best Sell
If you are still confused or have not fully understood how market depth works, the concept is similar to the situation below:

Ali is selling a used car. He wants to sell it for RM10,000.
Then Mei Mei wants to buy the car but she only wants to pay RM9,000. So will Mei Mei be able to own the car?
The answer is obviously no because Ali wants to sell at RM10,000.
So the options Mei Mei has as a buyer are:
- Be willing to add another RM1k to immediately own the car at RM10k
- Or be willing to wait a bit longer until the car price drops to RM9k.
Either way, it is up to Mei Mei as the buyer.
The same applies if you are an investor. Whether you are willing to queue and buy at a higher price or wait until the price falls to the level you queued at.
Meanwhile, the options Ali has as a seller are:
- Be willing to wait a bit longer until there is another buyer willing to buy at Ali''s asking price of RM10k
- Or be willing to lower the price, sell at a lower price of RM9k because he wants to sell immediately to a ready buyer, Mei Mei.
Everything depends on the emotions of the buyer and seller themselves. This is exactly what happens in the Market Depth on trading platforms when buying and selling stocks.
Market Depth Video Explanation
If you find watching a video easier, feel free to watch the video below:
Conclusion
Market Depth is an essential tool for understanding the volume of buy and sell orders in the stock market. By understanding the concept of Demand and Supply, you can make smarter trading decisions.
FAQ About Market Depth
1. What is Market Depth in stocks?
Market Depth is a display of buy (bid) and sell (ask) orders that shows the level of demand and supply at each price level for a stock counter on Bursa Malaysia.
2. How does Market Depth help in stock trading?
Market Depth helps you see the strength of buyers and sellers at each price level. If demand (bid) is greater than supply (ask), it indicates strong buying pressure.
3. Where can I view Market Depth?
Market Depth can be viewed through trading platforms such as Mplus Online or other trading applications that support Bursa Malaysia data. Make sure your CDS account is active.
4. What is the difference between Market Depth and stock charts?
Market Depth shows real-time buy and sell orders, while stock charts show historical price movements. Both are important for trading analysis.
Start Your Investment Journey
Now that you understand Market Depth, it is time to start investing and apply this knowledge in real trading.
Open a CDS Account: Open a CDS account with Mplus today to access Market Depth and start trading stocks.
Download Free Ebook: Get your free stock basics ebook from Mahersaham for a complete investment guide.