What Is GDP (KDNK)? Calculation, Facts & Malaysia's Global Ranking

Ever heard the news "Malaysia's economy grew 5.2%!" and wondered — what exactly is being measured? Or perhaps you've wondered why Singapore seems "richer" even though it's a tiny country?
The answer lies in one crucial number in economics: GDP or in Malay, KDNK (Keluaran Dalam Negeri Kasar).
In short: GDP is the total monetary value of all goods and services produced within a country over a specific period (usually a year). Think of it as a country's "payslip" — the higher the GDP, the more economic activity is taking place.
In this article, we'll break down what GDP is, how it's calculated, and most interestingly — how Malaysia ranks compared to Southeast Asian countries and the world.
Definition of GDP — What Does It Mean?
Gross Domestic Product (GDP) or Keluaran Dalam Negeri Kasar (KDNK) in Malay is the total market value of all final goods and services produced within a country's geographic borders over a given period.
The key words here are:
- "Domestic" — only counts economic activity occurring within Malaysia, regardless of whether the company is locally or foreign-owned
- "Gross" — means depreciation of capital assets has not been deducted
- "Final goods and services" — only finished products, not raw materials that will be further processed (to avoid double counting)
Simple example: If a factory in Johor produces a car worth RM100,000, that value counts towards Malaysia's GDP — even if the factory is owned by a Japanese company.
GDP vs GNP — What's the Difference?
Many confuse GDP with GNP (Gross National Product) or KNK (Keluaran Negara Kasar) in Malay:
| Aspect | GDP | GNP |
|---|---|---|
| Measures | Economic activity within a country's borders | Economic activity by a country's citizens (including overseas) |
| Example | Toyota factory in Johor = counted in Malaysia's GDP | Malaysian worker in Singapore = counted in Malaysia's GNP |
| Usage | More popular, used by IMF & World Bank | Less common, better suited for countries with large diasporas |
How Is GDP Calculated?
There are 3 approaches to calculating GDP, and theoretically all three should yield the same figure. The Department of Statistics Malaysia (DOSM) uses all three methods to verify data accuracy.
1. Expenditure Approach
This is the most popular and easiest to understand method. The famous formula:
GDP = C + I + G + (X − M)
Where:
- C = Consumer Spending — household expenditure on food, clothing, cars, etc.
- I = Investment — business spending on machinery, factories, buildings
- G = Government Spending — civil servant salaries, infrastructure projects
- X − M = Net Exports — value of exports minus value of imports
Practical Malaysian example: When you buy nasi lemak (C), a company builds a new highway (I), the government builds a hospital (G), and Malaysia exports palm oil (X) — all of this contributes to GDP.
2. Income Approach
This method calculates GDP from the income received by factors of production:
GDP = Wages + Rent + Interest + Profits + Indirect Taxes + Depreciation
This means: sum up all worker wages, land/building rent, loan interest, corporate profits, sales taxes, and asset depreciation.
3. Production/Value-Added Approach
This method calculates GDP based on the value added at each stage of production:
GDP = Total Output Value − Total Intermediate Inputs
Example: If raw wood worth RM50 is processed into furniture worth RM200, the value added is RM150. This method is useful for seeing each economic sector's contribution.
Nominal GDP vs Real GDP — An Important Distinction
This is a concept many overlook:
- Nominal GDP: Calculated using current prices. If prices rise (inflation), nominal GDP also rises even if output quantity remains the same.
- Real GDP: Calculated using a fixed base year's prices. This isolates the effect of inflation and shows actual economic growth.
Why does this matter? When the government announces "the economy grew 5.2%", they're referring to Real GDP growth — meaning the economy truly expanded, not just prices going up.
Malaysia's Latest GDP — 2025 Data
The latest data from the Department of Statistics Malaysia (DOSM) shows Malaysia's impressive economic performance:
Quarterly Growth 2025
| Quarter | GDP Growth | Notes |
|---|---|---|
| Q1 2025 | 4.4% | Stable, driven by private consumption |
| Q2 2025 | 4.4% | Maintained momentum, services sector strong |
| Q3 2025 | 5.2% | Increasing, active private investment |
| Q4 2025 | 6.3% | Highest since Q4 2022 |
| Full Year 2025 | 5.2% | Better than 5.1% in 2024 |
According to Kosmo Digital, Malaysia's economy grew 5.2% in 2025, surpassing the 5.1% achieved the previous year. The Q4 growth of 6.3% was the highest since Q4 2022.
Sector Contribution (2025)
| Sector | Growth | Contribution |
|---|---|---|
| Construction | 12.4% | Main driver, mega infrastructure projects |
| Services | 5.1% | Largest sector, includes trade & finance |
| Manufacturing | 4.5% | E&E exports |
| Agriculture | 2.2% | Palm oil, rubber |
| Mining | 0.5% | Crude oil, natural gas |
Data from the Ministry of Finance Malaysia (MOF) shows private consumption and investment remained the main demand drivers.
Key GDP Figures for Malaysia
- Nominal GDP: ~USD 470.57 billion (2025 estimate)
- GDP Per Capita: ~USD 13,901 (2025 estimate)
- World Ranking: 36th by nominal GDP
- Southeast Asian Ranking: 5th by nominal GDP, 3rd by per capita
Malaysia vs Southeast Asia — Who's the ASEAN Economic Champion?
This is the most fascinating comparison. Malaysia is often compared with its ASEAN neighbours, and data from the IMF World Economic Outlook gives a clear picture:
ASEAN Nominal GDP Comparison (2025 Estimates)
| Country | Nominal GDP (USD Billion) | GDP Per Capita (USD) | World Ranking |
|---|---|---|---|
| Indonesia | 1,443 | 5,074 | 17 |
| Singapore | 574 | 94,481 | 28 |
| Thailand | 559 | 7,942 | 31 |
| Philippines | 494 | 4,321 | 33 |
| Vietnam | 485 | 4,745 | 34 |
| Malaysia | 471 | 13,901 | 36 |
| Myanmar | 61 | 1,097 | 92 |
| Cambodia | 49 | 2,812 | 98 |
| Laos | 17 | 2,174 | 142 |
| Brunei | 16 | 33,858 | 147 |
Source: Worldometers / IMF WEO 2025
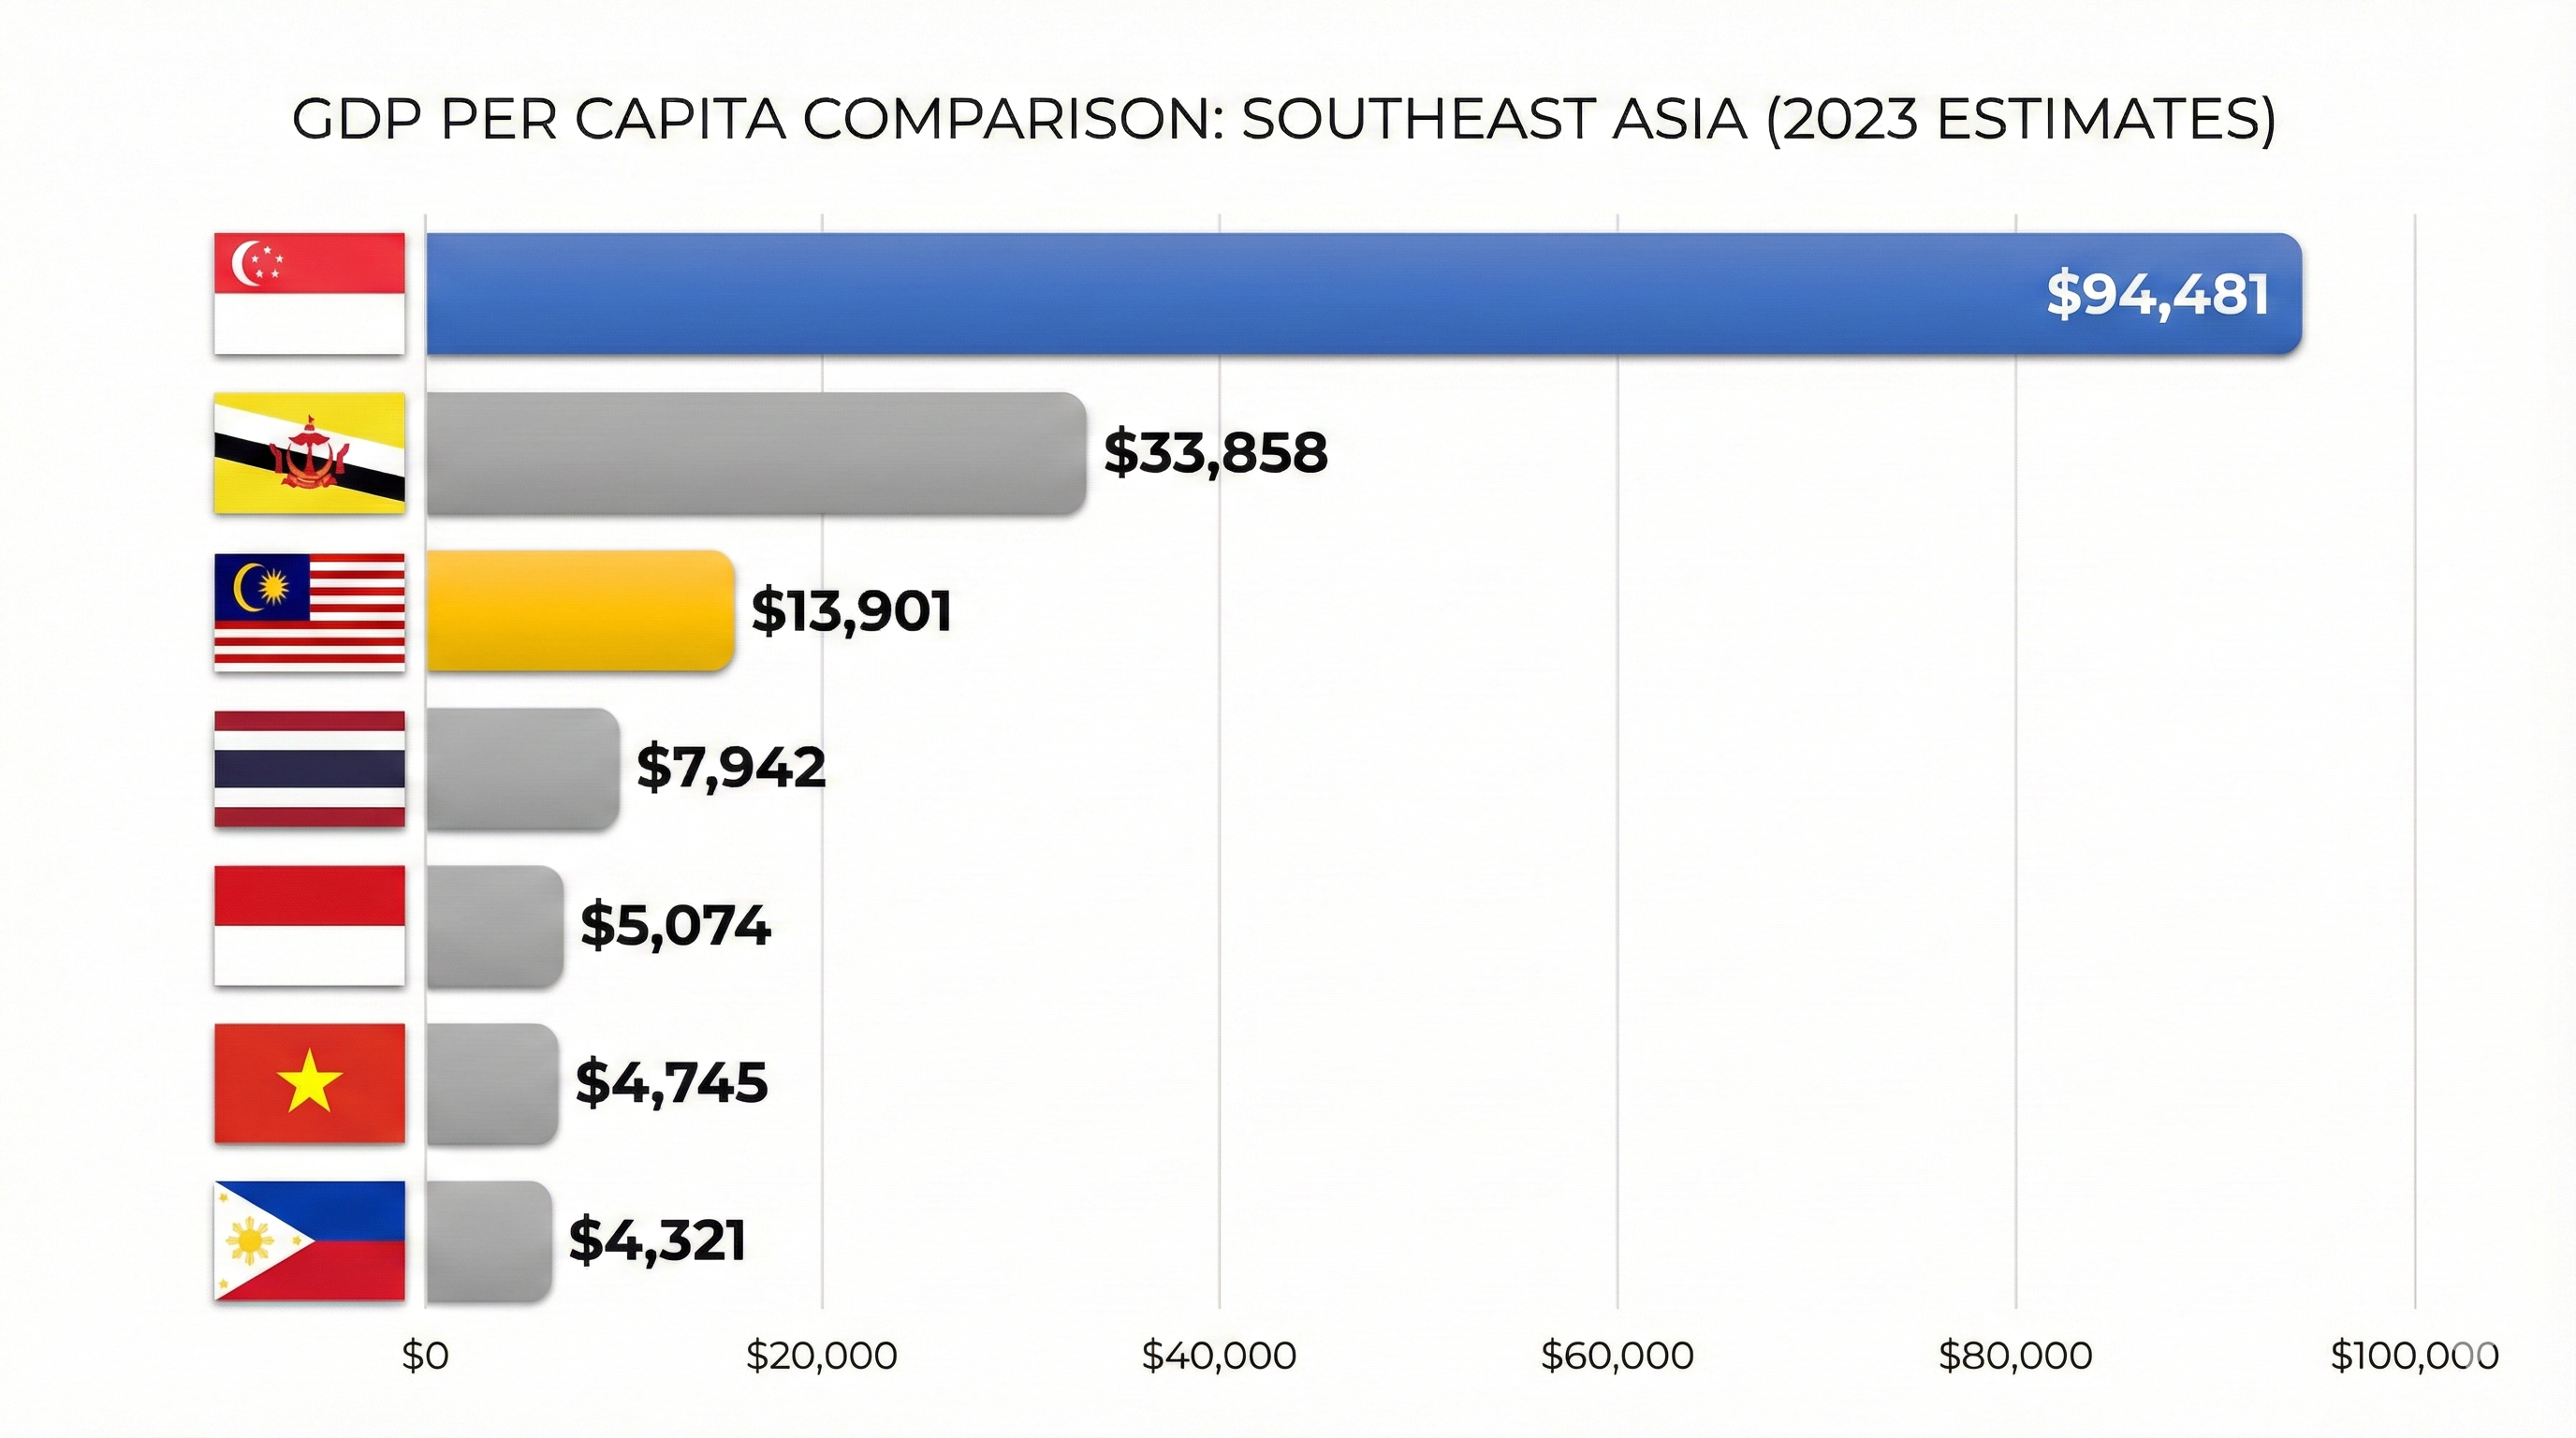
What Can We Learn From This Table?
Indonesia dominates in terms of size — with a GDP of USD 1.4 trillion, it far exceeds other ASEAN nations. This is because Indonesia's population exceeds 275 million. However, its GDP per capita is only USD 5,074 — among the lowest in the group.
Singapore is the classic example of "small but mighty". Although its nominal GDP is "only" USD 574 billion, its GDP per capita reaches USD 94,481 — making it the 4th richest country in the world by per capita. This is because of its small population (~5.9 million) but highly productive economy.
Malaysia occupies a unique position: in terms of GDP size, we rank 5th in ASEAN. But in terms of GDP per capita (USD 13,901), Malaysia ranks 3rd — behind only Singapore and Brunei. According to InvestKL, this figure approaches the global average of USD 14,450 and exceeds the Southeast Asian average of USD 6,141.
This means even though Malaysia's economy isn't as large as Indonesia or Thailand overall, the average wealth of Malaysians is higher than most ASEAN neighbours.
Malaysia vs The World — Where Do We Stand?
For a global perspective, let's compare Malaysia with the world's largest economies:
Top 10 World Economies vs Malaysia (2025)
| Ranking | Country | Nominal GDP (USD Trillion) |
|---|---|---|
| 1 | United States | ~29.2 |
| 2 | China | ~19.5 |
| 3 | Germany | ~4.7 |
| 4 | Japan | ~4.4 |
| 5 | India | ~4.3 |
| 6 | United Kingdom | ~3.7 |
| 7 | France | ~3.2 |
| 8 | Italy | ~2.4 |
| 9 | Brazil | ~2.3 |
| 10 | Canada | ~2.2 |
| 36 | Malaysia | ~0.47 |
Source: IMF World Economic Outlook, October 2025
Malaysia may look small compared to economic giants, but some interesting facts:
- Malaysia's GDP is roughly on par with Hong Kong and Israel — two highly developed economies
- Malaysia's 5.2% growth outpaces most developed nations — US (~2.5%), Germany (~0.8%), Japan (~1.0%)
- Malaysia is the 3rd largest economy in ASEAN after Indonesia and Thailand (Singapore is higher in nominal terms but very close)
The relationship between national debt and GDP is also important — the debt-to-GDP ratio is a key benchmark for a country's financial health.
Why GDP Matters for Investors
As an investor on Bursa Malaysia, understanding GDP isn't just "general knowledge" — it directly impacts your investment portfolio:
- Stock market direction indicator: Rising GDP usually means company earnings are also increasing, which in turn drives stock prices up
- Bank Negara OPR decisions: GDP data influences Overnight Policy Rate (OPR) decisions — if GDP runs too hot, OPR may be raised to cool the economy
- Foreign fund flows: Foreign investors look at GDP growth before deciding to invest in a country. Malaysia's solid 5.2% growth attracts foreign capital
- Ringgit strength: Healthy GDP supports the Malaysian Ringgit's value against other currencies
- Sector selection: GDP data by sector helps investors identify rapidly growing sectors — for example, the construction sector grew 12.4% in 2025
Frequently Asked Questions (FAQ) — GDP & KDNK
What's the difference between GDP and KDNK?
There's no difference — GDP stands for Gross Domestic Product in English, while KDNK stands for Keluaran Dalam Negeri Kasar in Malay. Both refer to the same thing.
Who calculates Malaysia's GDP?
The Department of Statistics Malaysia (DOSM) is responsible for calculating and publishing Malaysia's GDP data every quarter. The data can be accessed for free through the OpenDOSM portal.
What is Malaysia's current GDP?
For 2025, Malaysia's GDP is approximately USD 470.57 billion (nominal), with real growth of 5.2% compared to 2024.
Does a high GDP mean citizens are rich?
Not necessarily. GDP measures total economic output. To measure "average citizen wealth", you need to look at GDP per capita (GDP divided by population). Indonesia's GDP is 3x larger than Malaysia's, but Malaysia's GDP per capita is nearly 3x higher.
What are the limitations of GDP as a measure?
GDP doesn't account for several important things: income inequality (wealth gap), the shadow economy (informal economy), quality of life, and environmental sustainability. This is why some economists suggest using additional indices like the HDI (Human Development Index).
Why is Singapore's GDP per capita so much higher than Malaysia's?
Singapore has a high-value economy (finance, technology, trade) with a very small population (~5.9 million). As a result, when GDP is divided by population, the per capita figure becomes very high (USD 94,481). Malaysia has a population of ~33 million with a more diversified economy.
How does GDP affect stock market investing?
Positive GDP growth usually means companies generate more revenue, consumers spend more, and investor confidence increases — all of which drive stock market gains. Conversely, declining GDP (recession) can cause market downturns.
What is Malaysia's GDP target for 2026?
Based on Bank Negara Malaysia and IMF projections, Malaysia's GDP growth is expected to be between 4.5% and 5.5% for 2026, supported by infrastructure investment, increasing exports, and robust domestic consumption.
Conclusion
GDP is the primary indicator of a nation's economic health. With 5.2% growth in 2025 and the 3rd highest GDP per capita in ASEAN, Malaysia demonstrates a solid economic foundation. Understanding GDP helps you as an investor and citizen make wiser financial decisions.
With Malaysia's economy continuing to grow, this is a great time to start building your own investment portfolio.
Open your CDS trading account today through the CDS account opening page to start investing on Bursa Malaysia.
Download the free Stock Market Basics ebook to understand the fundamentals before making your first investment.
Further Reading
- US National Debt Hits $36.5 Trillion: Impact on the Global Economy
- OPR Decisions: Impact on Malaysia's Economy & Stock Market
- Personal Financial Management: Smart Ways to Manage Money
- MSCI Indonesia Issue: Bursa Malaysia Now on Foreign Fund Radar
- MSCI Warning: Why Indonesia's Stock Market Faced Its Worst Fall Since 1998